
A practical valuation technique that outperforms the market
How I made over 100% return on Games Workshop

While the crowd panicked over the shortage of toilet tissues in 2020, I was being a busy bee, probing in the stock market for nectar.
I was hesitant to post this article, as it is an excerpt from my investment diary. After careful consideration, I have taken a leap of faith to share my investing approach.
There are many books written about valuation models, with analysts and financial experts constantly debating over their preferred methods. Some valuation methods are difficult to follow while others are outdated.
When the market relapsed on March 2020, I found that the advanced Graham & Dodd method, adopted by Bruce Greenwald for valuing companies reduced the risk of significant losses in my portfolio.
In this post, I will share my valuation for Games Workshop Group PLC, a British manufacturer of miniature war games, trading on the London Stock Exchange with a stock ticker GAW.
As a word of caution, I did not cite this valuation from Games Workshop or its associates. These are my own valuations with references from publicly available sources thus it may not fully represent the true worth of the company.
What is a Moat?
In Berkshire Hathaway’s annual shareholder meeting (1995), Warren Buffett described a Moat as the “most important thing “, for the company’s economic posture.
Like a deep ditch surrounding a castle to fend off enemies, a moat in finance is a barrier that protects an incumbent from its rivals. It is also the economic advantage of a firm’s assets that cannot be replicated and reproduced by its competitors.
The first step in assessing a moat is to identify rivals and the competitive landscape in which it operates.
Identifying a moat can be challenging in practice. However, it is an important part of the valuation work as it reinforces the strategic position of the company.
The Competitive Landscape
In the miniature war games niche, Games Workshop has not extended beyond its barrier. There are only a few direct competitors who own their brand and intellectual property of miniature war games, thus it is safe to assume that the company is the overall dominant leader with the highest market share within its segment.
The companies that can directly compete for market share and customer captivity are few and smaller size private companies. They are also not listed in an exchange, e.g., Mantic Games, Fantasy Flight Games, Corvus Belli, Megacon Games, WYRD and Privateer Press.
Competitors who are publicly listed in an exchange include Hasbro, Mattel, Funko, CMN. However, they have a different target audience, product line and business model.
Reproduction Cost
After screening the company, I concluded that Games Workshop was a suitable subject for my valuation. The company has been thriving for the last five years and so I wanted to get in on the action during the market draw down.
As the legendary investor, John Templeton used to say, “buy when others are despondently selling and to sell when others are avidly buying requires the greatest fortitude and pays in the greatest reward.”
The industry is growing in popularity. According to Statista, the global board game market will be worth $12 billion (£8.9 billion) in 2023.
Since the industry is doing well, I will not value the business by the liquidation approach. I do not need to estimate parts of the company’s assets I can salvage or sell for scrap from the balance sheet.
The liquidation method is sufficient when valuing a declining industry. If the industry was saturated, Games Workshop’s income would shrink and drag down the value of its assets, e.g. specialised equipment that may be harder to salvage and intangibles.
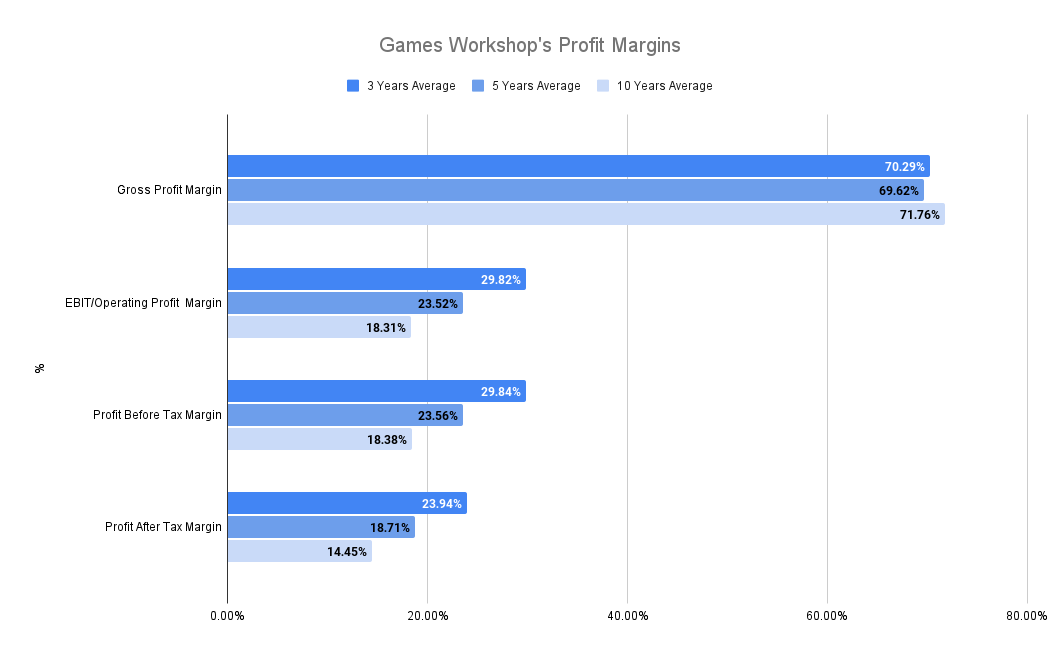
However, the evidence below suggests that the company and industry are stable. Games Workshop’s average profit margin for the last three years (29.82%) was much higher than their five (23.52%) and ten years (18.31%).
For these reasons, I intend to use the reproduction cost to conduct my initial valuation.

Economic value
For firms in a viable business, the economic value of an asset is the reproduction cost, which is what it would take for a new entrant to compete.
The first question I asked myself was:
"How much would it cost me to recreate the exact business in the most efficient way possible?"
Or
"How much would I need to pay to replace the company’s assets today in the most efficient way of producing them?"
To answer the question, I had to go through the company’s balance sheet to perform some accounting adjustments.
Why the Balance Sheet?
The balance sheet is a financial statement that reflects the company’s financial position. It includes their assets that drive the earnings and financial obligation to its debt and equity holders.
Although the balance sheet is a snapshot of a company’s financial activity at a point in time, it shows all its past transactions since inception and accumulated worth.
Balance Sheet valuation
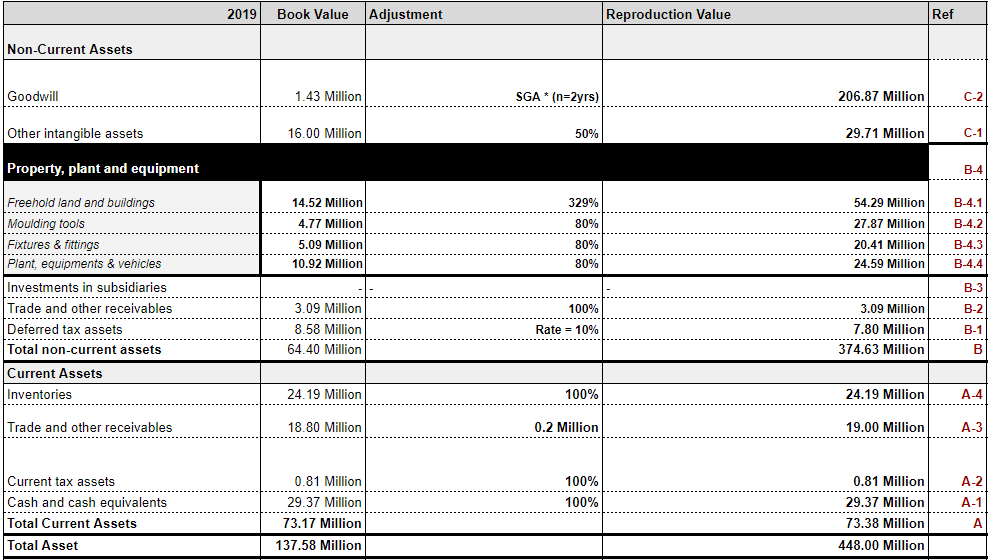
To estimate the reproduction value of Games Workshop, I started with the current asset on the 2019 balance sheet. I then worked my way through the list of fixed assets.
The reproduction value adjustment table:
Current Assets (Section A)
A-1) Cash is the money the company has deposited in the bank, and so I valued it at 100%.
Cash and equivalents = £29.37mA-2) The Current tax asset is the tax that Games Workshop expects to recover from the trading period. I valued it at 100%.
Current tax assets = £0.81mA-3) I added back credit loss from trade receivables because I expect that not all the billable allowance will be recoverable from customers and so the cost of reproducing Games Workshop’s trade receivables will probably be more than the amount stated in the book value.
Trade receivables = £3.09mA-4) I kept inventories at 100% with no adjustments. Usually, most companies use the FIFO (First-In, First-Out) , LIFO (Last-In, First-Out) or the weighted average method for their inventories.
FIFO means that companies sell the oldest products first, while for LIFO, they sell the newest products first. The weighted average allocates the average cost of goods available for sale to the units sold and remaining in the inventory.
As a competitor entering the market, I would have done my research first to see what products sell to reduce the cost of unsellable or defective products that can affect sales.
Inventories = £24.1mA) The total current reproduction cost of the asset is £73.38 million, which is £0.21 million more than the current assets listed in their balance sheet for the year 2019.
Non-current Assets (Section B)
B-1) Deferred tax is an asset that Games Workshop will use to reduce tax on their future bill.
Deferred tax often happens when a company overpays on their recent tax or pays their future tax in advance. I used a 10% discount factor as a conservative estimate since I am only interested in the present value.
1/(1+0.10)^1, where 0.10 or 10% is the estimated discount rate that I used for Games Workshop.
Deferred tax assets = £7.80m
B-2) I valued trade receivables in the non-current section of the balance sheet at 100% as there were no losses.
Trade and other receivables(non-current) = £3.09mB-3) There were no figures in the investment subsidiaries, and so I skipped it.
B-4) For property, plants and equipment (PPE), I split it into four components. I estimated the value of each asset at gross depreciation, as I assumed it to be the entry cost to replicate the same asset.
Property Plants and Equipment = £124.87mB-4.1) Freehold from the PPE appreciates in value for lands and buildings. I added 329% to the value.
Unfortunately, I couldn’t find an appraiser to value the land or commercial real-estate holdings. I also checked the land registry, but the amount they purchased the property was not disclosed.
I visited a real-estate websites and searched for nearby commercial properties. I used google map to estimate the size of their land in square metres and converted it to square foot. The land was 28,000 square meters (301,389.49 square feet).
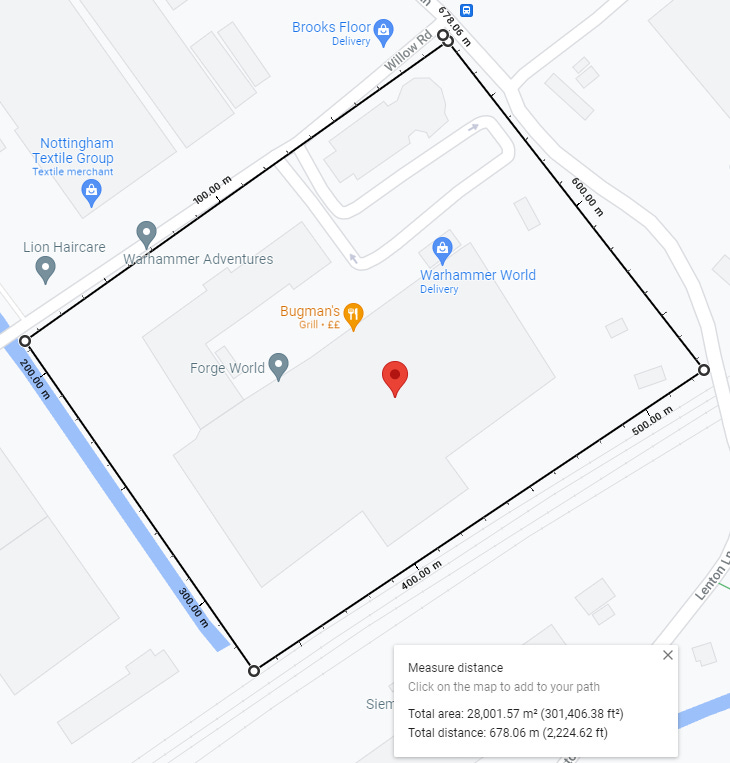
Similar freehold properties nearby cost between £45-55 per square feet, so the land value ranges from 13.6 to 16.5 million. The estimate for the land is close to what is stated on the financial statement at gross depreciation.
Land Cost a) 301,3089.5*45 per sq. ft = 13.6 m
Land Cost b) 301,3089.*55 per sq. ft =  16.5m
As an entrant, I could use 15%-20% of the cost of buying the land for building and renovation (2.9million = 17.5% of 16.5m).
Note that the land and building value is where GAW conducts their research, design, manufacture and distributes their products.
I have not accounted for the retail and trade channels for storage facilities, store fronts and telesales. Most of the buildings may be leased and so they need to be included as part of the asset in the balance sheet.
Since IFR16 will be adjusted to their financial statement in 2020, I added the right-of-use estimate (34.9 million) to asset in the valuation.

Freehold Land & Buildings = £16.5m
Renovation = 2.9 m
Right-Of-Use = 34.9m
Total = 16.5m + 2.9m + 34.9m = 54.3m
% Adjustment = (54.3m/16.5m)*100 = 329%
B-4.2) I purposely valued the moulding tool at 80% after adjusting for their wear and tear. I assumed entrants can purchase a moulding tool below the current value.
Moulding Tools = £27.87mB-4.3) Like the moulding tool, I valued the cost of fittings and fixtures at 80%. I assumed new entrants can replace the fittings and fixtures less than it originally cost the company.
Fixtures & Fittings = £20.41mB-4.4) I also valued the plants, equipment & vehicles at 80%.
Plant, Equipment & Vehicles = £24.59mIntangible Assets (Section C)
C-1) Other intangible assets for Games Workshop are computer software and development cost. I valued both at gross amortisation, however; I reduced the cost to 50%.
Software development has a limited shelf-life because of technological obsolescence, innovation and industry demand for upgrades and versions.
In the company’s footnotes, it states that, “Product development costs recognised as intangible assets are amortised on a reducing balance basis with rates ranging from 50% to 80% to match the expenditure incurred to the expected revenue generated from the subsequent product release.”
C-2) Goodwill on a financial statement refers to the excess of cash from acquiring an asset above the company’s book value. I did not use the goodwill figure in the balance sheet to estimate the reproduction cost.
Goodwill from a reproduction cost refers to the intangible assets that a company uses to create value e.g. Branding, customer relationship, and advertising to develop customer loyalty, licenses, store positioning, distribution network, purchasing organisation and the connection with reliable sources who manufacture the goods.
Bruce Greenwald describes the example above in his book as hidden assets. I can derive these hidden assets from Games Workshop’s research and development (R&D) and General Selling and Administration (SGA).
According to the notes section for Games Workshop, they do not undertake research activities. Development activities are part of the creation and expansion of new product lines, which I have already included in other intangible assets in my valuation.
I used a multiple between 1-3 years for the SGA to calculate and reproduce the cost of assets for Goodwill.
Selling General & Administration = £206.87 millionThe total reproduction cost assets were £448 million, while the book value for the total asset was £137.58 million.
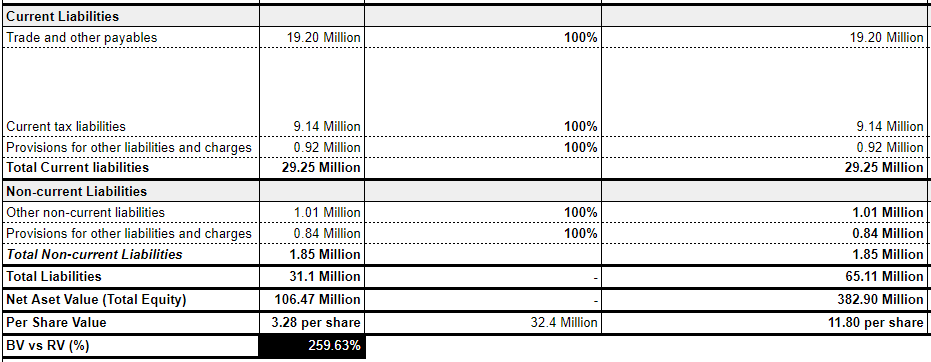
Liabilities & Total Equity
I valued the reproduction cost for liabilities in the same way as their book value, and I received a total equity value of £416.90 million. I adjusted the non-current liabilities to include their lease liabilities (34 million), which reduced the figure to 382.90 million.
Although there are many ways to estimate the reproduction cost, the table below gives me an idea of the approximate cost of copying the business if I were to enter the miniature market to compete directly with Games Workshop. The reproduction cost is also an easy way to identify the implicit value of the company.
Now that I know how much it will cost to reproduce their assets, I need to calculate the company’s earnings power value (EPV).
What are Earnings Power Value?
Earnings Power Value (EPV) is the company’s average earnings potential, taking out any accounting manipulation as it sits today. It is also the net sustainable and distributable earnings of the company without growth.
Although EPV is less reliable than the reproduction cost or book value because of the varying assumptions about the cost of capital, the valuation bridges the gap between the company’s assets, debt obligations, and its earning efficiency without uncertainties about the future growth.
The valuation ignores growth because growth neither adds nor creates value. Growth requires additional funding, which the business will eventually pay back to their debt and equity holders.
Growth will only add value when it is over the reproduction cost, i.e. Franchise value, which I will cover in greater detail, but for now let’s calculate the EPV.
The formula for EPV is the adjusted earnings multiplied by one divided by the cost of capital (R).
Adjusted Earning * 1/RDiscounting Vs Capitalisation
There are two valuation methods that are popular amongst analysts and investors, e.g., Discounting and Capitalisation. I wanted to highlight that the EPV uses a capitalisation method.
The main reason I use capitalisation instead of the DCF method is that the terminal value for discounting in a discounted cash flow model (DCF) generates a larger margin of error if there is a slight change in the growth rate or discount rate. A DCF model does not address the figures on the balance sheet, which is one financial statement for enterprise valuation.
In the Capitalisation method, I don’t project all the future economic income. I only focus on a single period, usually the normalised economic income expected in the year, while smoothing out any accounting discrepancies to growth. The amount for the single period represents the long-term sustainable base level of economic income.
Capitalisation is a simplified version of discounting, however, the common error that investors make is to use capitalisation as a discounted rate. This is only possible if the expected economic income, following the valuation date, is constant with zero growth.
Adjusted Earnings composition
EBIT is the profit the business makes while operating, less interest and taxes. In the absence of non-income interest from joint ventures, EBIT is synonymous with operating profit.
Profits fluctuate because of business cycles, operational gearing and competition, and so I had to revise the EBIT for Games Workshop to come up with an reasonable measure of the profits from operations.
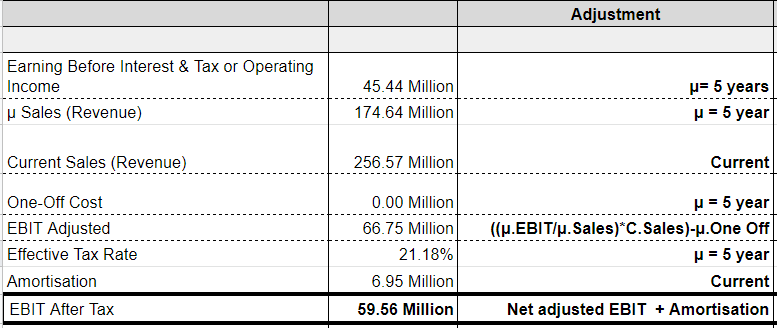
To workout the after tax EBIT:
Calculate the average EBIT for the last five years because of the changes in management strategy and improvement in their product line. I could have chosen the last three years as an option because of the company’s improved operating leverage and revenue growth.
Ignore the one-off item or non-recurring item from the EBIT if it does not show up repeatedly in the income statement, i.e. year to year.
If the one-off cost is recurring, calculate the average one-off item for the last five years and subtract the results from the average EBIT.
Divide the average EBIT by the average sales for the last five years to get an EBIT margin.
Multiply the EBIT margin by the current sale figure to get an adjusted EBIT.
Take away the average effective tax rate for the last five years from the adjusted EBIT to get the after tax EBIT.
Add back amortisation expense to the after tax EBIT.
The EBIT after tax was £59.56 million for Games Workshop.
Adjusted Earnings explained
The adjusted earnings are the amount of cash that Games Workshop can give back to its owners annually without affecting its operations. Another name for the adjusted earnings is the earnings power.
The legendary investor, Warren Buffett, refers to it as the Owner’s Earnings. Earnings power is the amount of money that the owners of the business can extract annually without harming the company’s operations.
Another way to convey the earnings power is to imagine a landlord with a rental apartment. The owner of an apartment gets rent (earnings) from their tenants, pays for the mortgage and annual upkeep (expenses from operations) and major repairs (maintenance and capital expenditure) like doors, windows, roof etc...
The amount remaining is not for the apartment as it is the freely distributed cash for the landlord’s pocket.
Calculating Adjusted Earnings
To workout the adjusted earnings:
I reviewed the property, plants and equipment at the end of the trading period and divided it by the corresponding revenue figure to get the PPE to Sales.
The company’s PPE to Sales was 0.14, which meant that for every £1 of sale the company made, they spent only 14 pence of their asset. This also shows an efficient use of their fixed assets to generate high revenue.
I multiplied the changes in sales (i.e. current year minus previous year’s sales) by the PPE to Sales, to calculate the growth capex.
I subtracted the recent year’s total capex (excluding any growth figures for both tangible and intangible assets) from the growth capex to get the maintenance capex. I used this method in place of depreciation as an actual estimate of the replacement capital costs.
I removed depreciation from the maintenance capex and added back the results to the EBIT after tax to get the adjusted earnings.

Accounting vs Earning Power Depreciation
In financial accounting, depreciation is the process of systematically allocating costs of fixed assets over a period during which the assets are expected to provide economic value.
However, in the earnings power estimate, actual depreciation is the cost of restoring the condition of the company’s fixed capital at the end of the year to its state at the beginning of the year. Thus, it is the actual expense required to replace the company’s capital stock or capital expenditure.
There are two main reasons for not using the accounting depreciation method to calculate the adjusted earnings power.
The first is to do with the historical costs for fixed assets. The results could be higher than what has been estimated in the accounting depreciation, especially for land (property), where the asset appreciates in value.
The second reason is to do with technology driven costs. Improvement in technology and obsolescence could lead to replacement costs below the historical costs, which may be overstated in the accounting depreciation.
The next step is to estimate the present value of the future cash flow to determine the risk or likelihood of the earnings power materialising, i.e. the Earnings Power Value (EPV).
Calculating Earnings Power Value
To complete the EPV, I needed to calculate the discount rate or weighted average cost of capital (WACC).
The WACC is the minimum rate of return that an equity holder expects to receive from the company. It is what the company has to pay each year to attract investors.
As an investor, when I buy shares in a company, not only am I withholding my consumption for future returns, I expose my money to many risks and so I expect to receive compensation for it.
These risks vary extensively, as they include systematic and unsystematic risks. And the greater the risk, the higher my expected rate of return.
Although there are financial models to measure the WACC, such as the Arbitrage Pricing Model (APM), Multi-factor Model, Proxy and the Capital Asset Pricing Model (CAPM), there are too many variables to distil and compute, which leads to lots of assumptions.
In a future post, I will share how to use the CAPM to value a company but for now a simpler yet crude way to approximate the rate of return is by starting with the lowest discount rate that venture capital firms command in the industry, then work my way down.
Venture capital firms have high-risk exposure in their portfolio with non-publicly listed companies.
As of 2019, venture capital firms use a 14%-50% discount rate. Games Workshop is a publicly listed company with little to no financial obligations, trading in the FTSE 250, therefore I expect their rate is between 8-10%.
EPV = 59.71m/9% = £663.4mComparing Values
To compare the EPV to the market price, I added back the excess cash and subtracted 1% of sales, which is the general amount needed to operate the business. The equation for the excess cash is the total cash minus the difference in total current liabilities and total non-cash assets.
The excess cash is the value of the ongoing assets that I can strip out of the business and add back to the ongoing earnings. It is also the amount generated beyond what the company needs to perform their daily operations.
A company generates excess cash when the total current non-cash assets cover their total current liabilities.
Excess Cash = Total Cash − (Total Current Liabilities − Total Current Non-cash Assets)
Total Cash = Cash & Cash Equivalents + Short-term Investments
Total Current Non-Cash Assets = Total Current Assets − Total Cash
On the balance sheet, the company did not have interest-bearing debt. Games Workshop had no pension deficit. Pension contribution was also part of the prepayments and accrual, and so I left it out of the valuation.
I divided the EPV (£704.84 million) by the number of shares in issue (32.44 million) to get the EPV per share (£23.00)

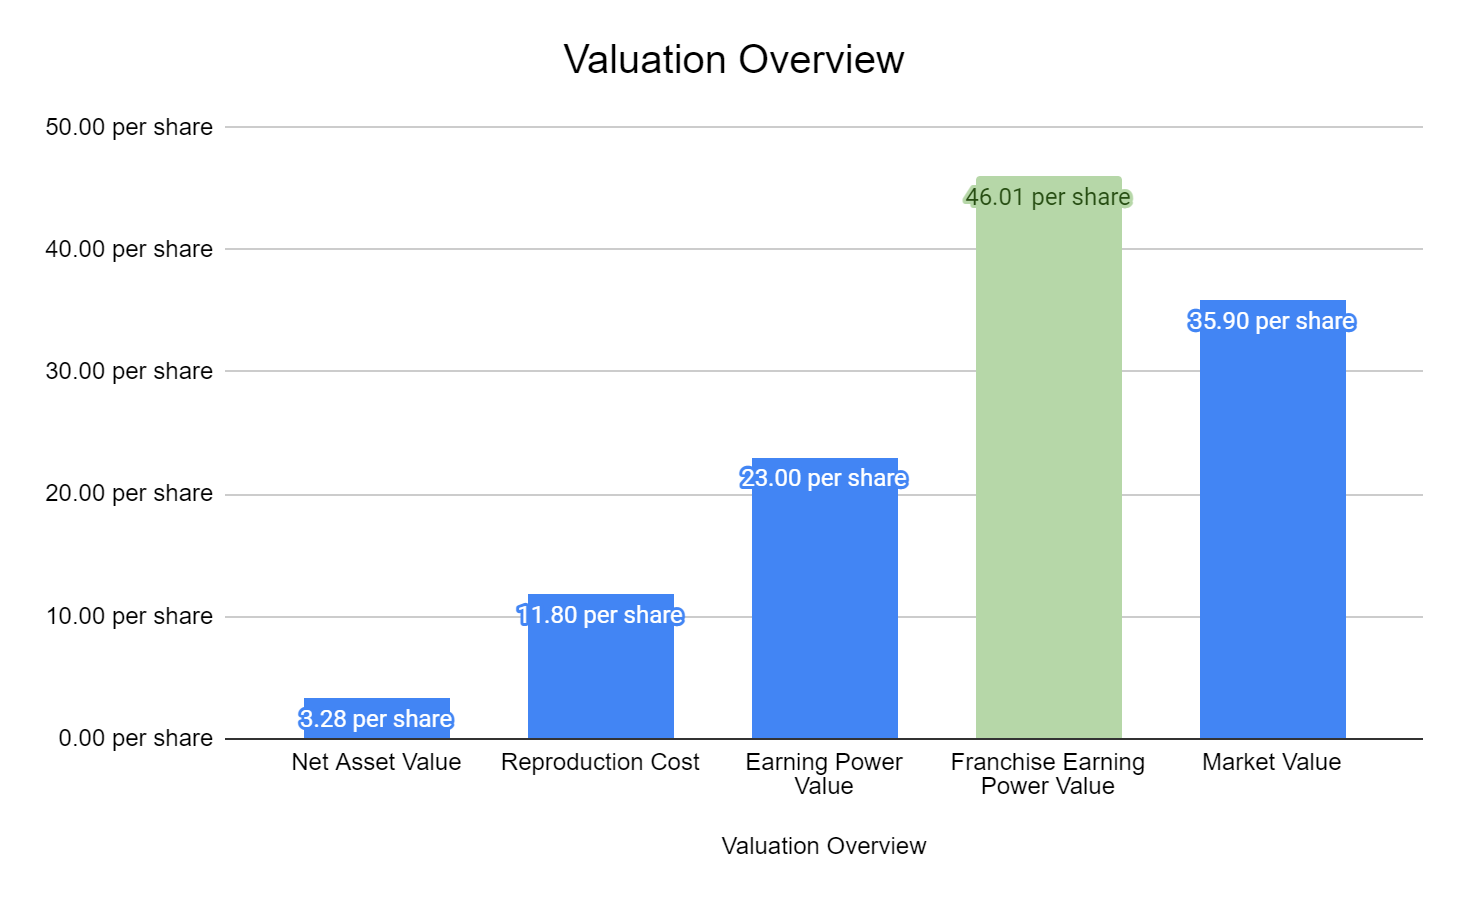
On 18th March 2020, the British PM, Boris Johnson, issued a Covid-19 warning. The day after, Games Workshop’s market price dropped to £35.90 per share while the EPV was £23.00 per share.
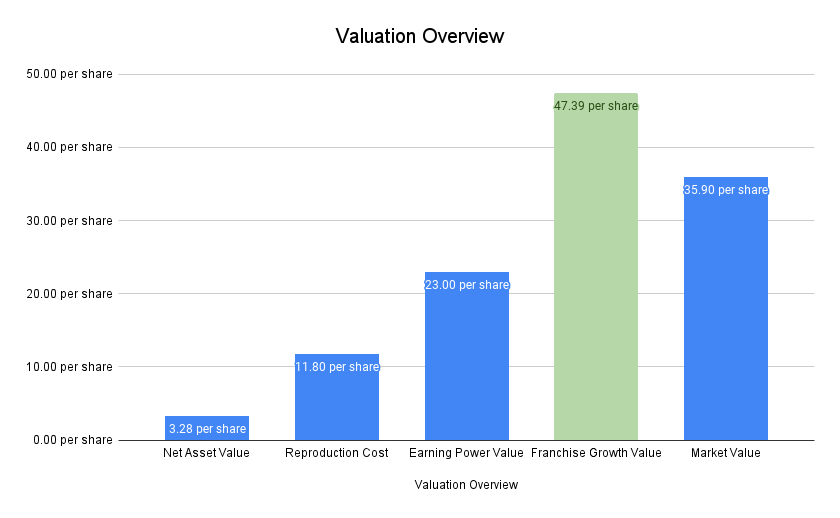
The table and chart below shows the summary of my valuation:
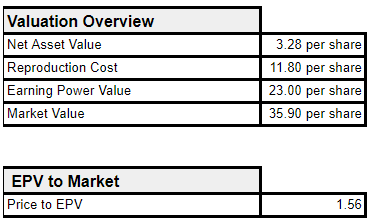
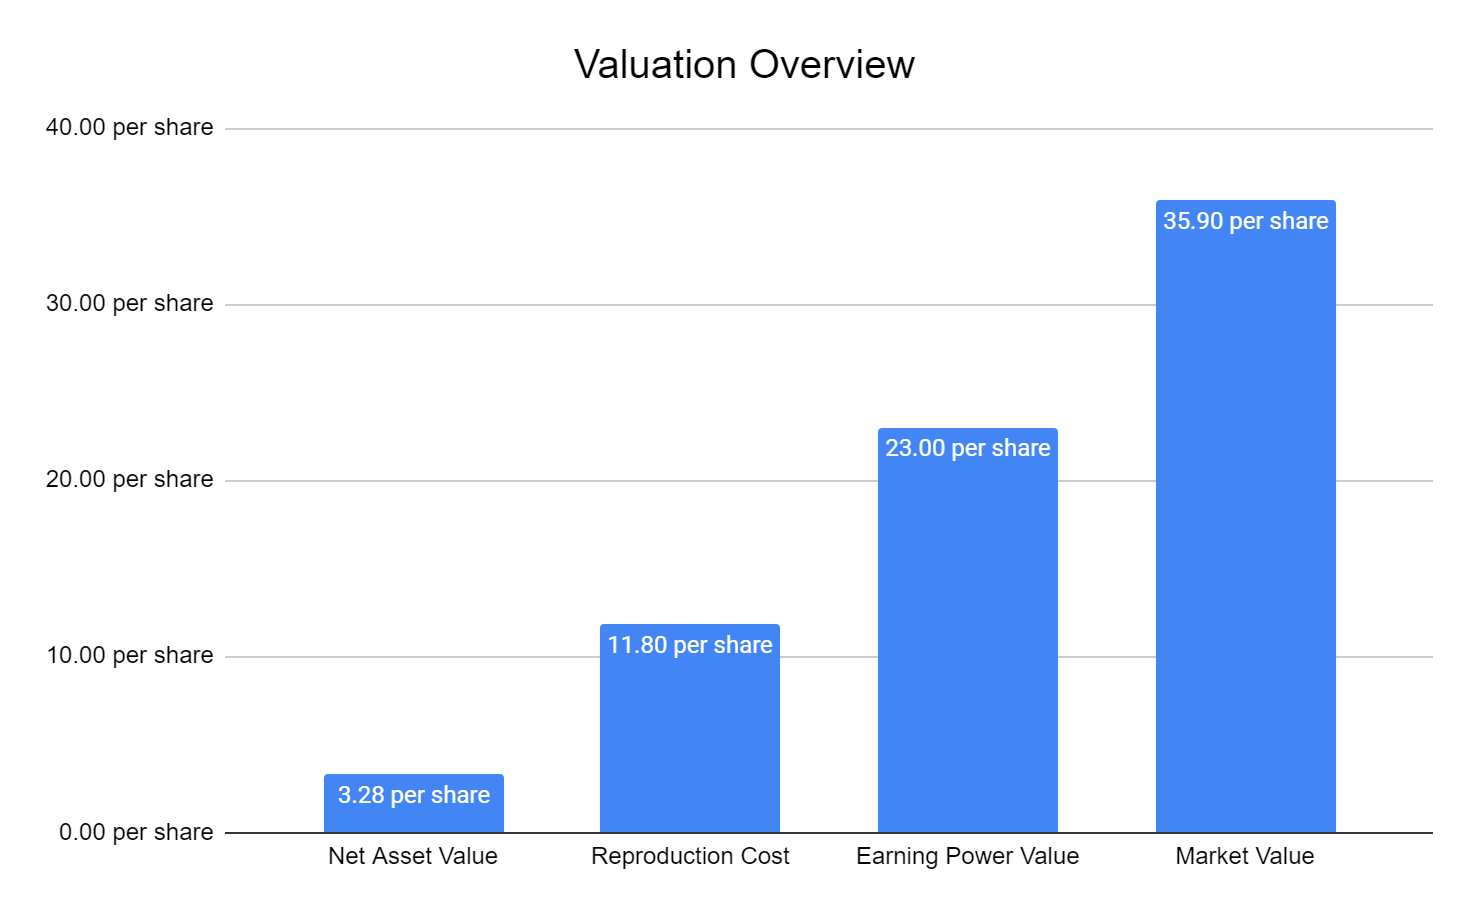
The company’s EPV was considerably higher than the reproduction cost and the net asset value. This meant that Games Workshop was earning more than it had in assets.
However, the market value was much more than the EPV, which suggests that the market was trading at a premium.
Normally I buy stocks with a price-to-EPV multiples below 1. Was it foolish or brave to have wanted to pay an exorbitant price as an investor?
To answer the question, I needed to explore the company’s franchise value to see if it is sustainable to determine my margin of safety.
How Stable Is The Franchise Value?
The franchise value is the difference between the asset value from the reproduction cost and the EPV. It is the excess return that a company with a competitive advantage makes after it has paid off its financial obligations.
Companies with a franchise value will make more money than they owe. They will stop competition from eating away a slice of their profits through methods like patents, proprietary technology, unbeatable economies of scale, strong customer captivity and influence. The higher the franchise value, the stronger the barrier to entry or moat.
If there were no barriers to entry, competition will continue to enter the market and erode the excess return the incumbent generates.
Although Games Workshop has a higher EPV than their asset and reproduction value, I wanted to check the stability and sustainability of their franchise value.
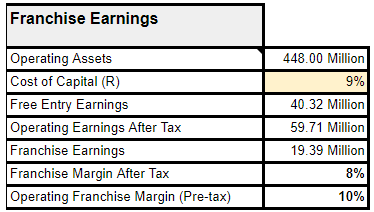
I multiplied the cost of capital (9%) by the operating asset from the reproduction cost (£448 million) to get their free entry earnings (£40.32 million).
The free entry earnings are the amount that has no special advantage. It is also the value of earnings that new entrants would achieve if they were to replicate the business.
Growth requires additional funding and capital comes from raising money through the issuing of shares to investors, taking out a loan from the bank and earnings from the company’s operations.
Suppose the net operating earnings were equal to the free entry earnings, the results would suggest that Games Workshop did not have a franchise value, i.e. making no additional money to fund growth.
Therefore, the free entry earnings are Games Workshop’s earnings that debt and equity holders expect to receive at a rate of 9%. It is also the same amount that entrants will need to compete with the incumbent.
When I took away the free entry earnings from the net operating earnings, I received a net franchise earnings of £19.39 million, which suggests that Games Workshop earn enough money to cover their cost of capital and growth.
To find out the 8% net franchise margin, I divided the franchise earnings by the revenue for the current year.
The net franchise margin is acceptable for Games workshop, it is not very high to attract too much competition and it is also not low to reduce their long-term value.
To calculate the 10% gross franchise margin, I divided the net franchise earnings by 1 minus the effective tax rate to get gross franchise earnings. I then divided the gross franchise by the revenue.
Margin Of Safety
To find out how much room I had between the company’s intrinsic value and the market price:
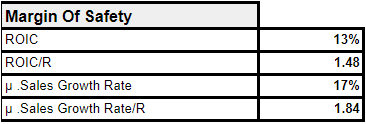
I divided the earnings after tax by the operating assets to get the return on invest capital.
ROIC = 59.71m/448m = 0.133*100 = 13%I then divided the return on invested capital by the cost of capital.
ROIC/R = 13.3%/9% = 1.48*100 = 148%I calculated the compound growth rate in sales for the last five years (17%) and divided it by the cost of capital to get the growth to cost of capital.
μ.Sales Growth Rate/R = 1.84 or 180%The Y axis (G/R) from the growth matrix below shows that Games Workshop results easily fit in the high 0.75 (75%) region.
Although Games Workshop’s ratio is 1.80 (180%), growth cannot exceed the cost of capital for a long period, otherwise the return on capital would be infinite, which is impossible.
The X axis (ROC/R) shows that Games Workshop sits in column B (1.5). The section where the X & Y axis intersects is the intrinsic value.
The results show the company is worth twice the value of the current EPV when I account for growth within the franchise.

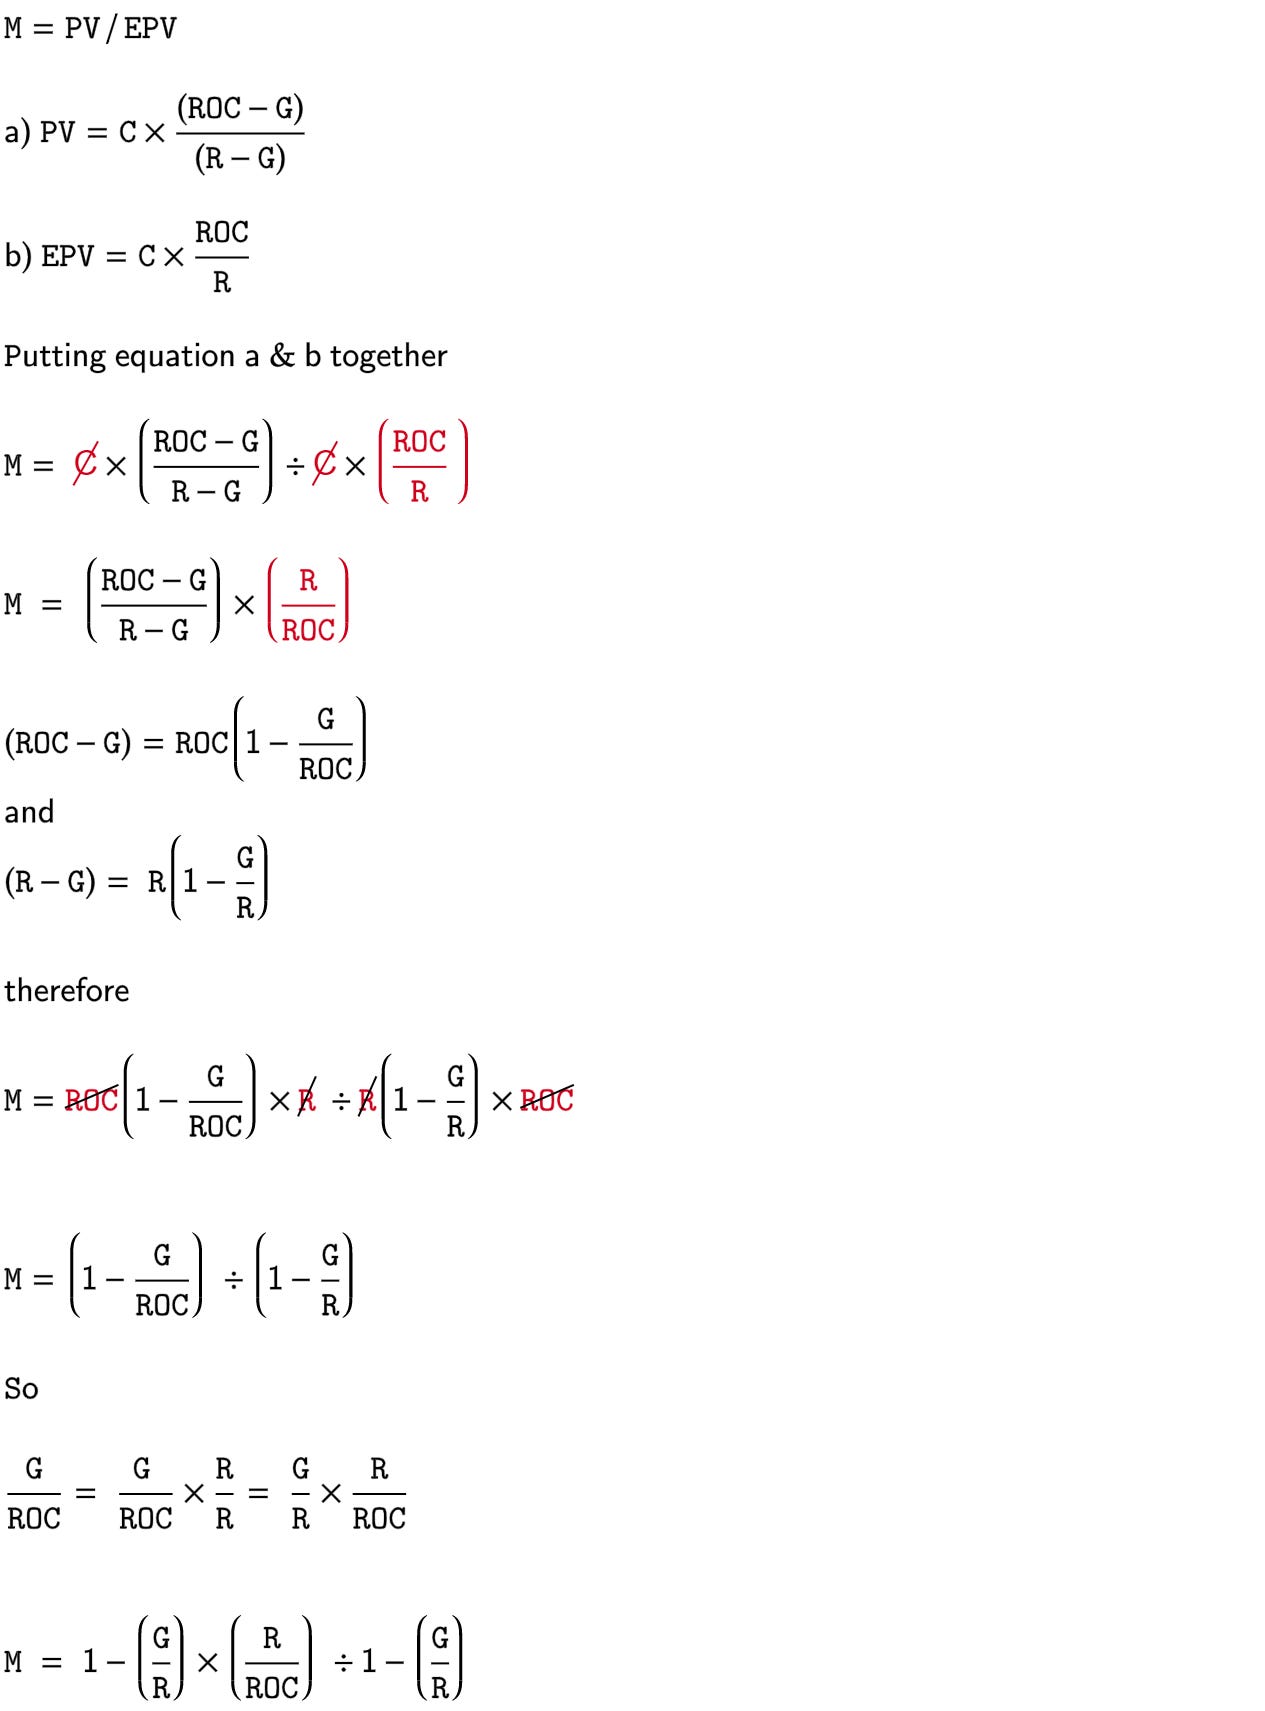
A break down of the growth matrix equation
The growth matrix tells us the value that growth creates within the franchise. It compares the present value (PV) of GAW to its EPV without growth.
I expressed the proportion that growth adds to the EPV using the growth multiplier formula:
Comparing Values
My margin of safety is above 20% as it is the most realistic and convenient spot to position my investment in the event of market drawdowns, considering how quickly stocks can decline to 10%. For Games Workshop’s valuation, my margin of safety was 28%.
Margin of Safety = (46.01p/35.90p)-1*100 = 28.16%I bought the stock and patiently waited till the market became bullish and the price exceeded £46 per share. I then raised my stop losses to trail at 20% behind today’s market price.
But wait, I haven’t finished!
A lot has changed since the last time I revisited my valuation for GAW. I wanted to come back with a fresh pair of eyes and a second edition of Value Investing from Buffet and Beyond. I haven’t sailed off to the sunset just yet.
The first edition of the book was brilliant! I was surprised when Bruce Greenwald, in his recent interview, advised his audience to ignore the first edition.
However, I am not ready to discard the first edition because it holds valuable pieces of information for valuing companies using asset value, reproduction and earnings power value.
Where the first edition falls short is the growth valuation for franchise companies. It doesn’t address three areas that can strengthen or threaten a franchise:
Cash return from the current earnings power
Micro-economic trends that influence organic growth
Quality of management’s capital allocation initiatives
Growth isn’t easy
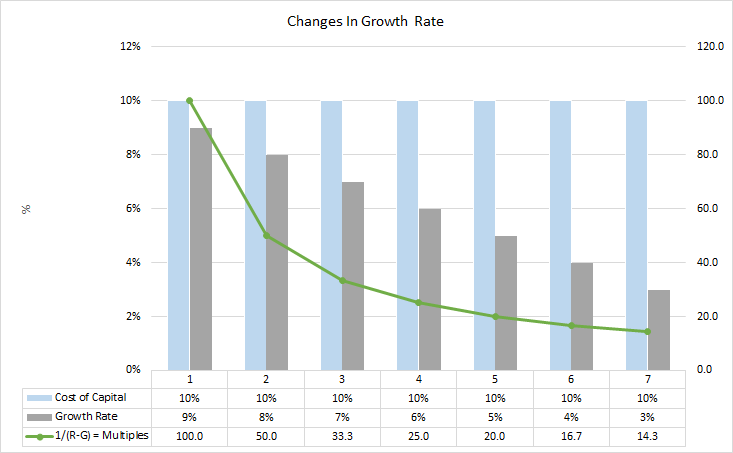
The intrinsic value of growth stocks cannot be calculated with high accuracy to be useful because estimating value far out into the future is challenging. Growth valuation is also sensitive to changes in the growth rate and cost of capital.
For instance, slight adjustments to the growth rate and cost of capital for the present value (PV) calculation can generate a huge margin of error because of compounding effects.
The charts show how a 1% or 2% difference between the cost of capital and growth rate for period 1 and 2 can create an enormous difference in multiples.

Cash Return On Current Earnings Power
Growth sits in franchise, i.e., distributable earnings above the cost of capital. By focusing on growth returns, I shift my attention from earnings-based valuation to franchise-based valuation.
When calculating returns, there are three questions to answer:
If I buy GAW at today’s price, what kind of return do I earn on the franchise?
What fraction of the return will be allocated to me as the investor?
What fraction of the return will be reinvested and retained by management?
Calculation for the cash returns on current earnings power:
I subtracted net cash from the market price to get the core value of the enterprise.
In 2019, the cash and cash equivalent on GAW balance sheet was 29.4 million. I subtracted it from their total liabilities (31.1 million) to get the net cash. I then subtracted the net cash amount from the Enterprise Value (EV).
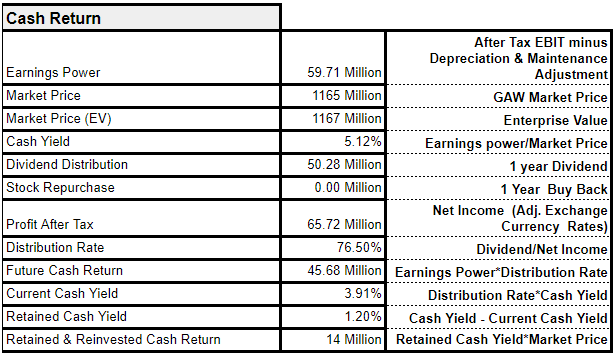
Net Cash = 29.4m-31.1m =-1.7m
Market EV =1.165b-(-1.7m) = 1.1667b or 1.167b
I divided the adjusted earnings by market price (EV) to get the earnings yield (5.12%). The earnings yield is the rate I will receive from buying all their shares at current market price.
Earnings Yield = 59.71m/1.167b = (0.0512)*100 (5.12%)
In 2019, GAW Distributed £50.28 million dividends. The company did not repurchase shares and their recent net income without interest was £65.70 million.
Finance income less finance cost was £97,000. This was 0.12% difference to their before tax profit. I excluded it because it was not significant enough to make a huge difference in the dividend calculation.
EBIT After Tax = 81.2*(1-19.1%) = 65.70millionI divided the dividend distribution by their net income to get the company’s recent distribution rate (76.50%).
Distribution Rate = 50.28m/65.70m = 0.7650*100 (76.50%)The distribution policy determine GAW’s future cash return (£45.68 million). I multiplied the distribution rate by the adjusted earnings to get the future cash return.
Future Cash Return = 76.50%*59.71m = 45.68m
The current cash yield for 2019 was 3.91%, which is shareholder’s return from GAW’s earnings power. For the current cash yield, I multiplied the distribution rate by the cash yield.
Current Cash Yield = 76.50%*5.12% = 3.91%The retained & reinvested cash return for the company’s operation was £14 million. This is the amount left over after taking away the current cash yield (3.91% ) from the earnings yield (5.12%).
I multiplied 1.20% by GAW’s market price (1.167 billion) to get the retained and reinvested cash return (14 million).
Retained Cash Yield = 5.12%-3.91% = 1.20%
Retained Cash Return = 1.20%*1.167b = 14m
So far, I have calculated:
The franchise return on today’s market price (5.12%)
The returns that will be allocated to investors from GAW’s distribution policy (3.91% or 45.68 million).
The amount that will be kept and reinvested into GAW (1.20% or 14 million)
The next step is to estimate how much organic growth contributes to the current cash yield.
Organic Growth
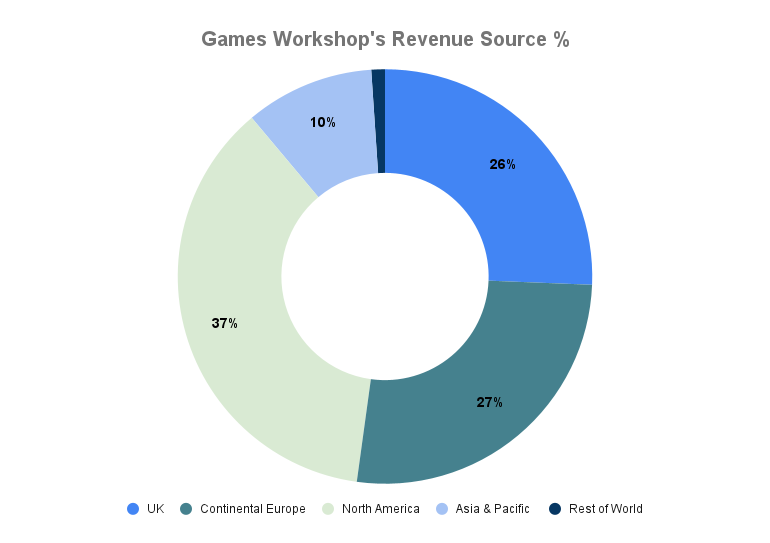
On average, North America continues to generate the most revenue for GAW (37%), followed by Continental Europe (27%), UK (26%) Asia Pacific (10%) and the rest of the world (1%).
Trade:
The company work closely with independent retailers, magazine newsstand business and the distributor sales from their publishing businesses.
Retail:
These are GAW’s retail stores, their visitor centre in Nottingham, and global exhibition.
Mail order:
Includes their web stores and digital sales through external affiliates.
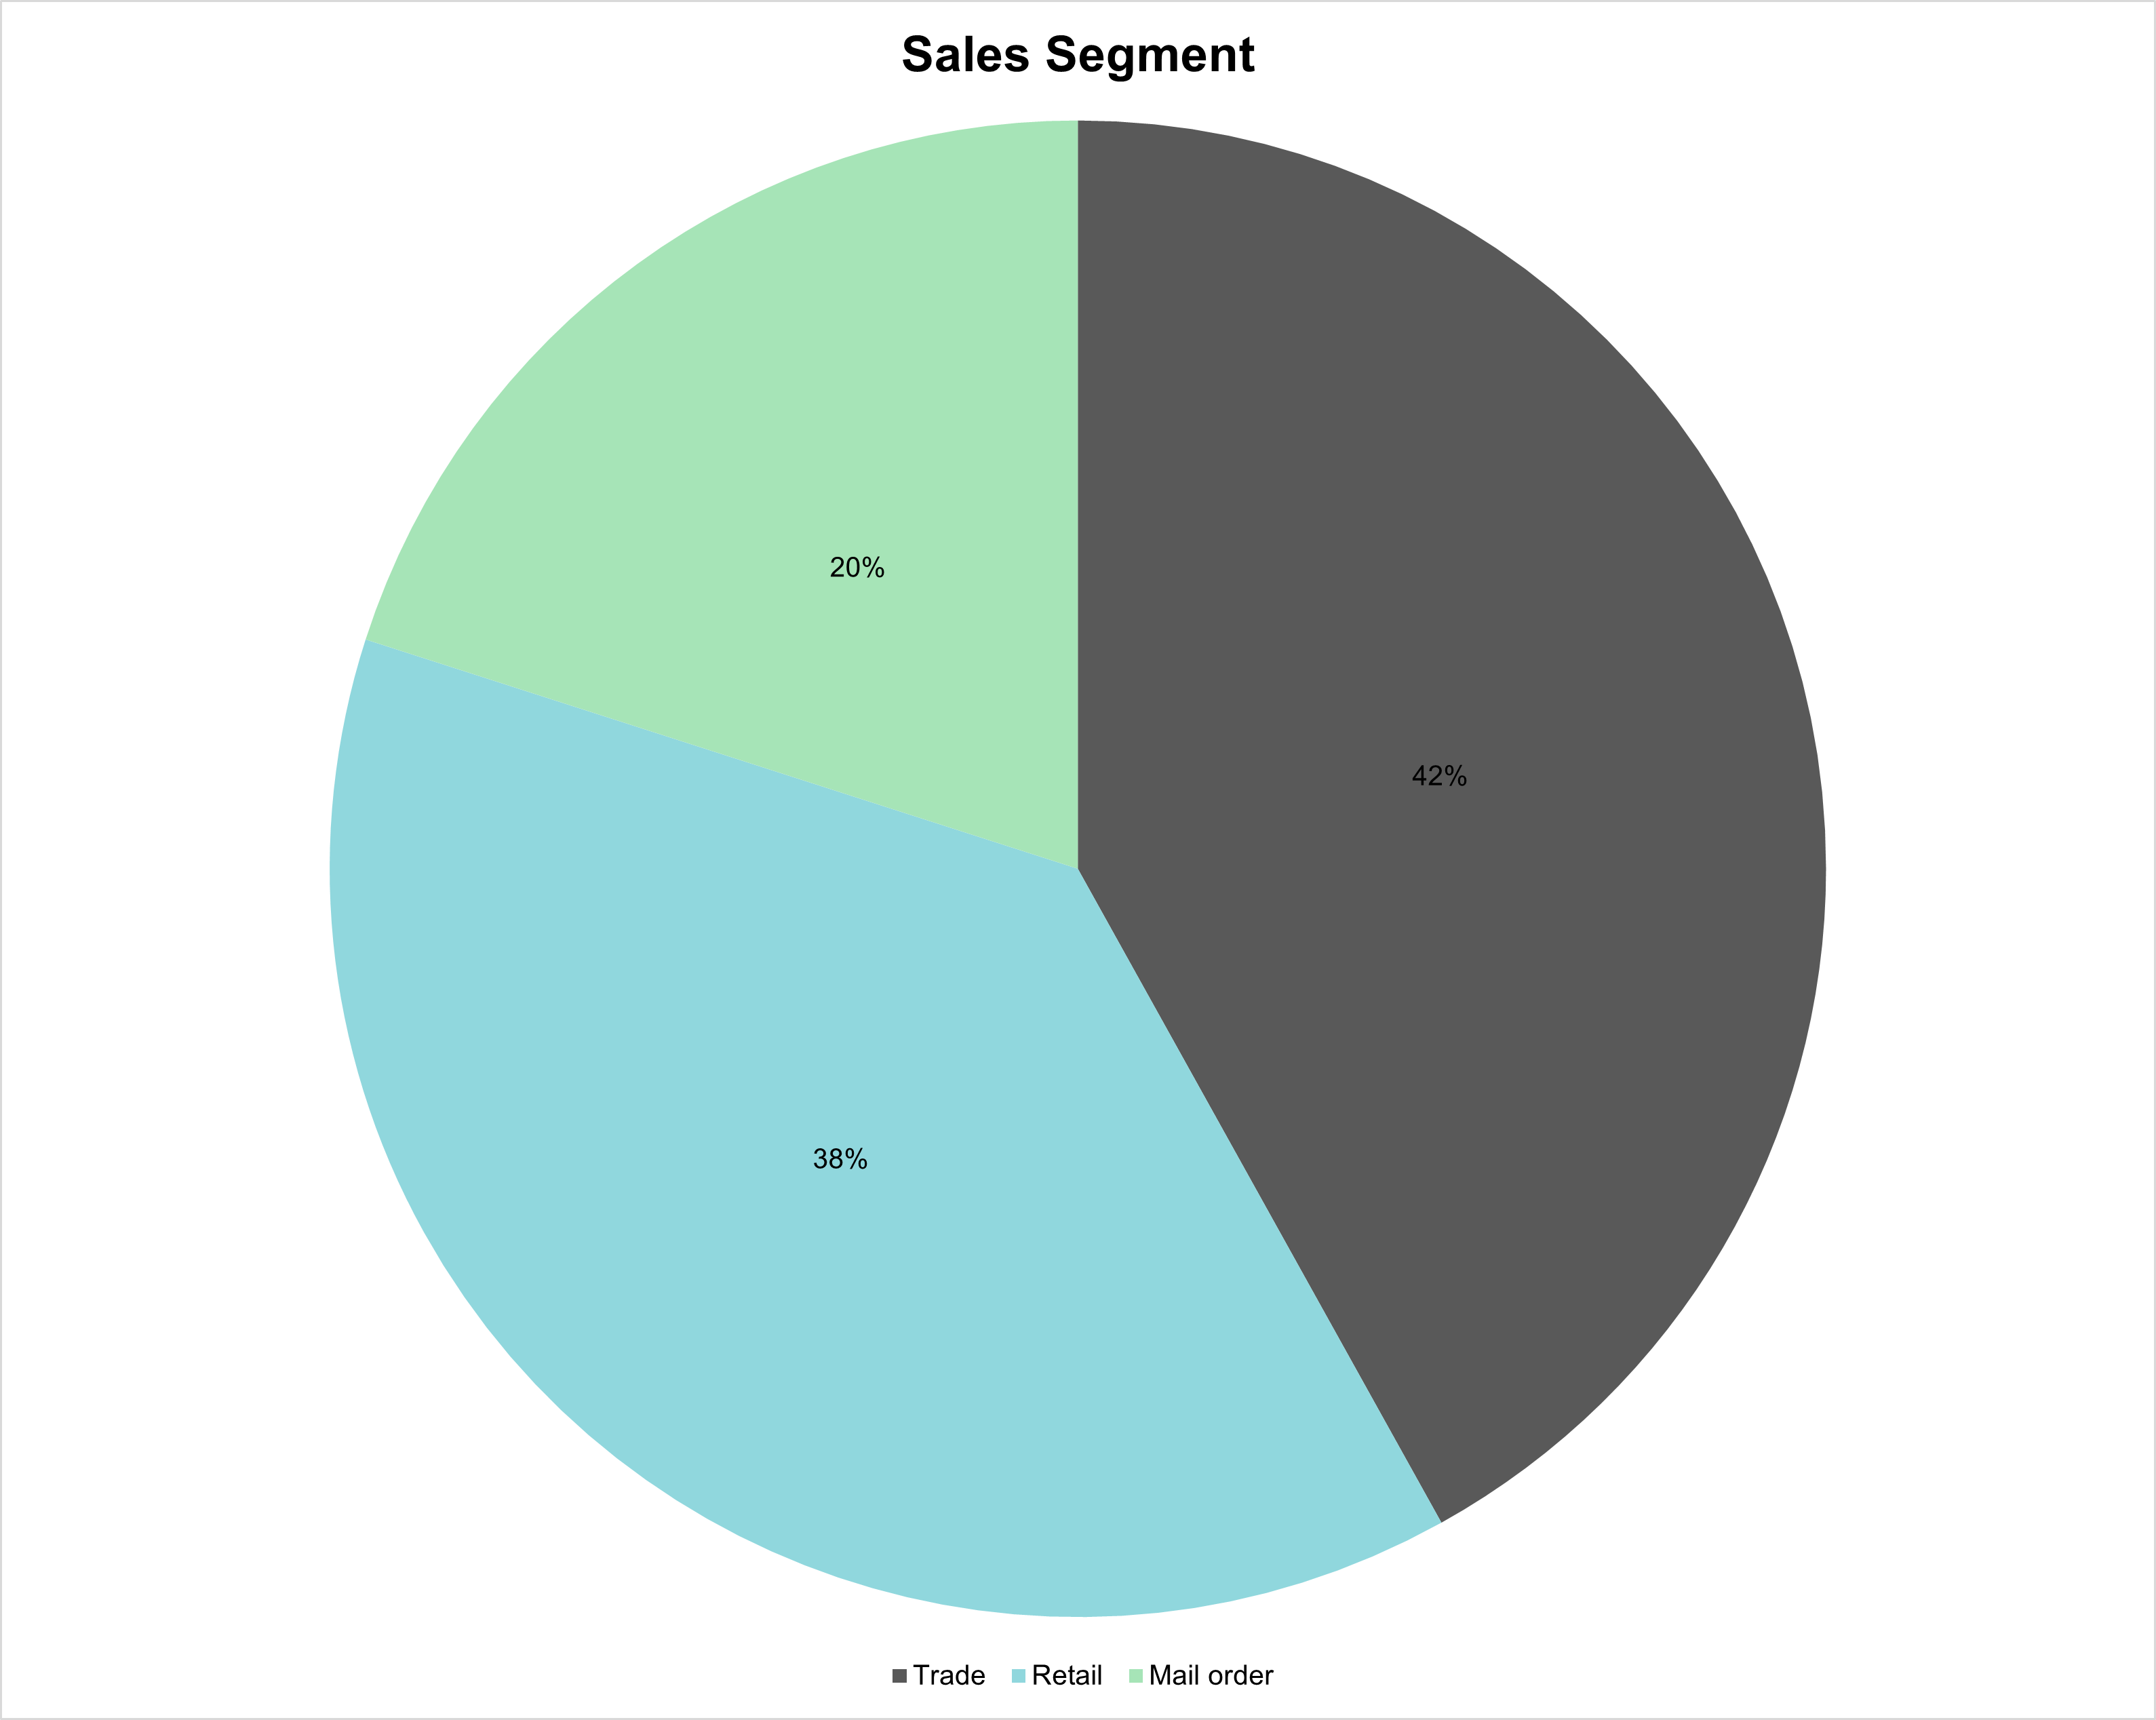
Trade channel makes up 42% of the company’s revenue. This is followed by their retail (38%) and mail order (20%).
In the sales segment, revenue channels are not too fragmented to lose control of their intellectual property or proprietary technology.
If the company were to lose some of their trade partners, they will be able to recover from their retail and mail order channel — vice versa.
GAW has been very careful not to expand far beyond its geographic barrier and product space. By dominating specific markets, they can enjoy a sustainable competitive advantage.
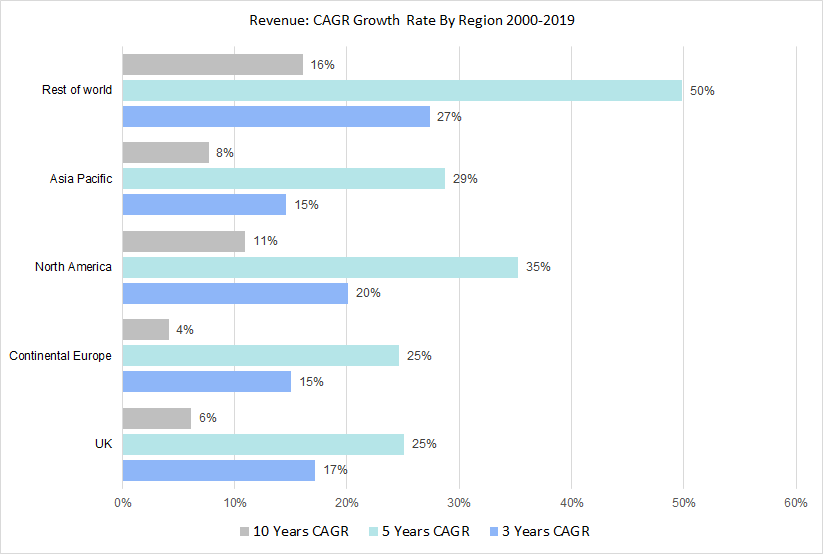
The increase in revenue and income suggests that GAW benefits from economies of scale, cost reduction from improved technology, and operational efficiency.
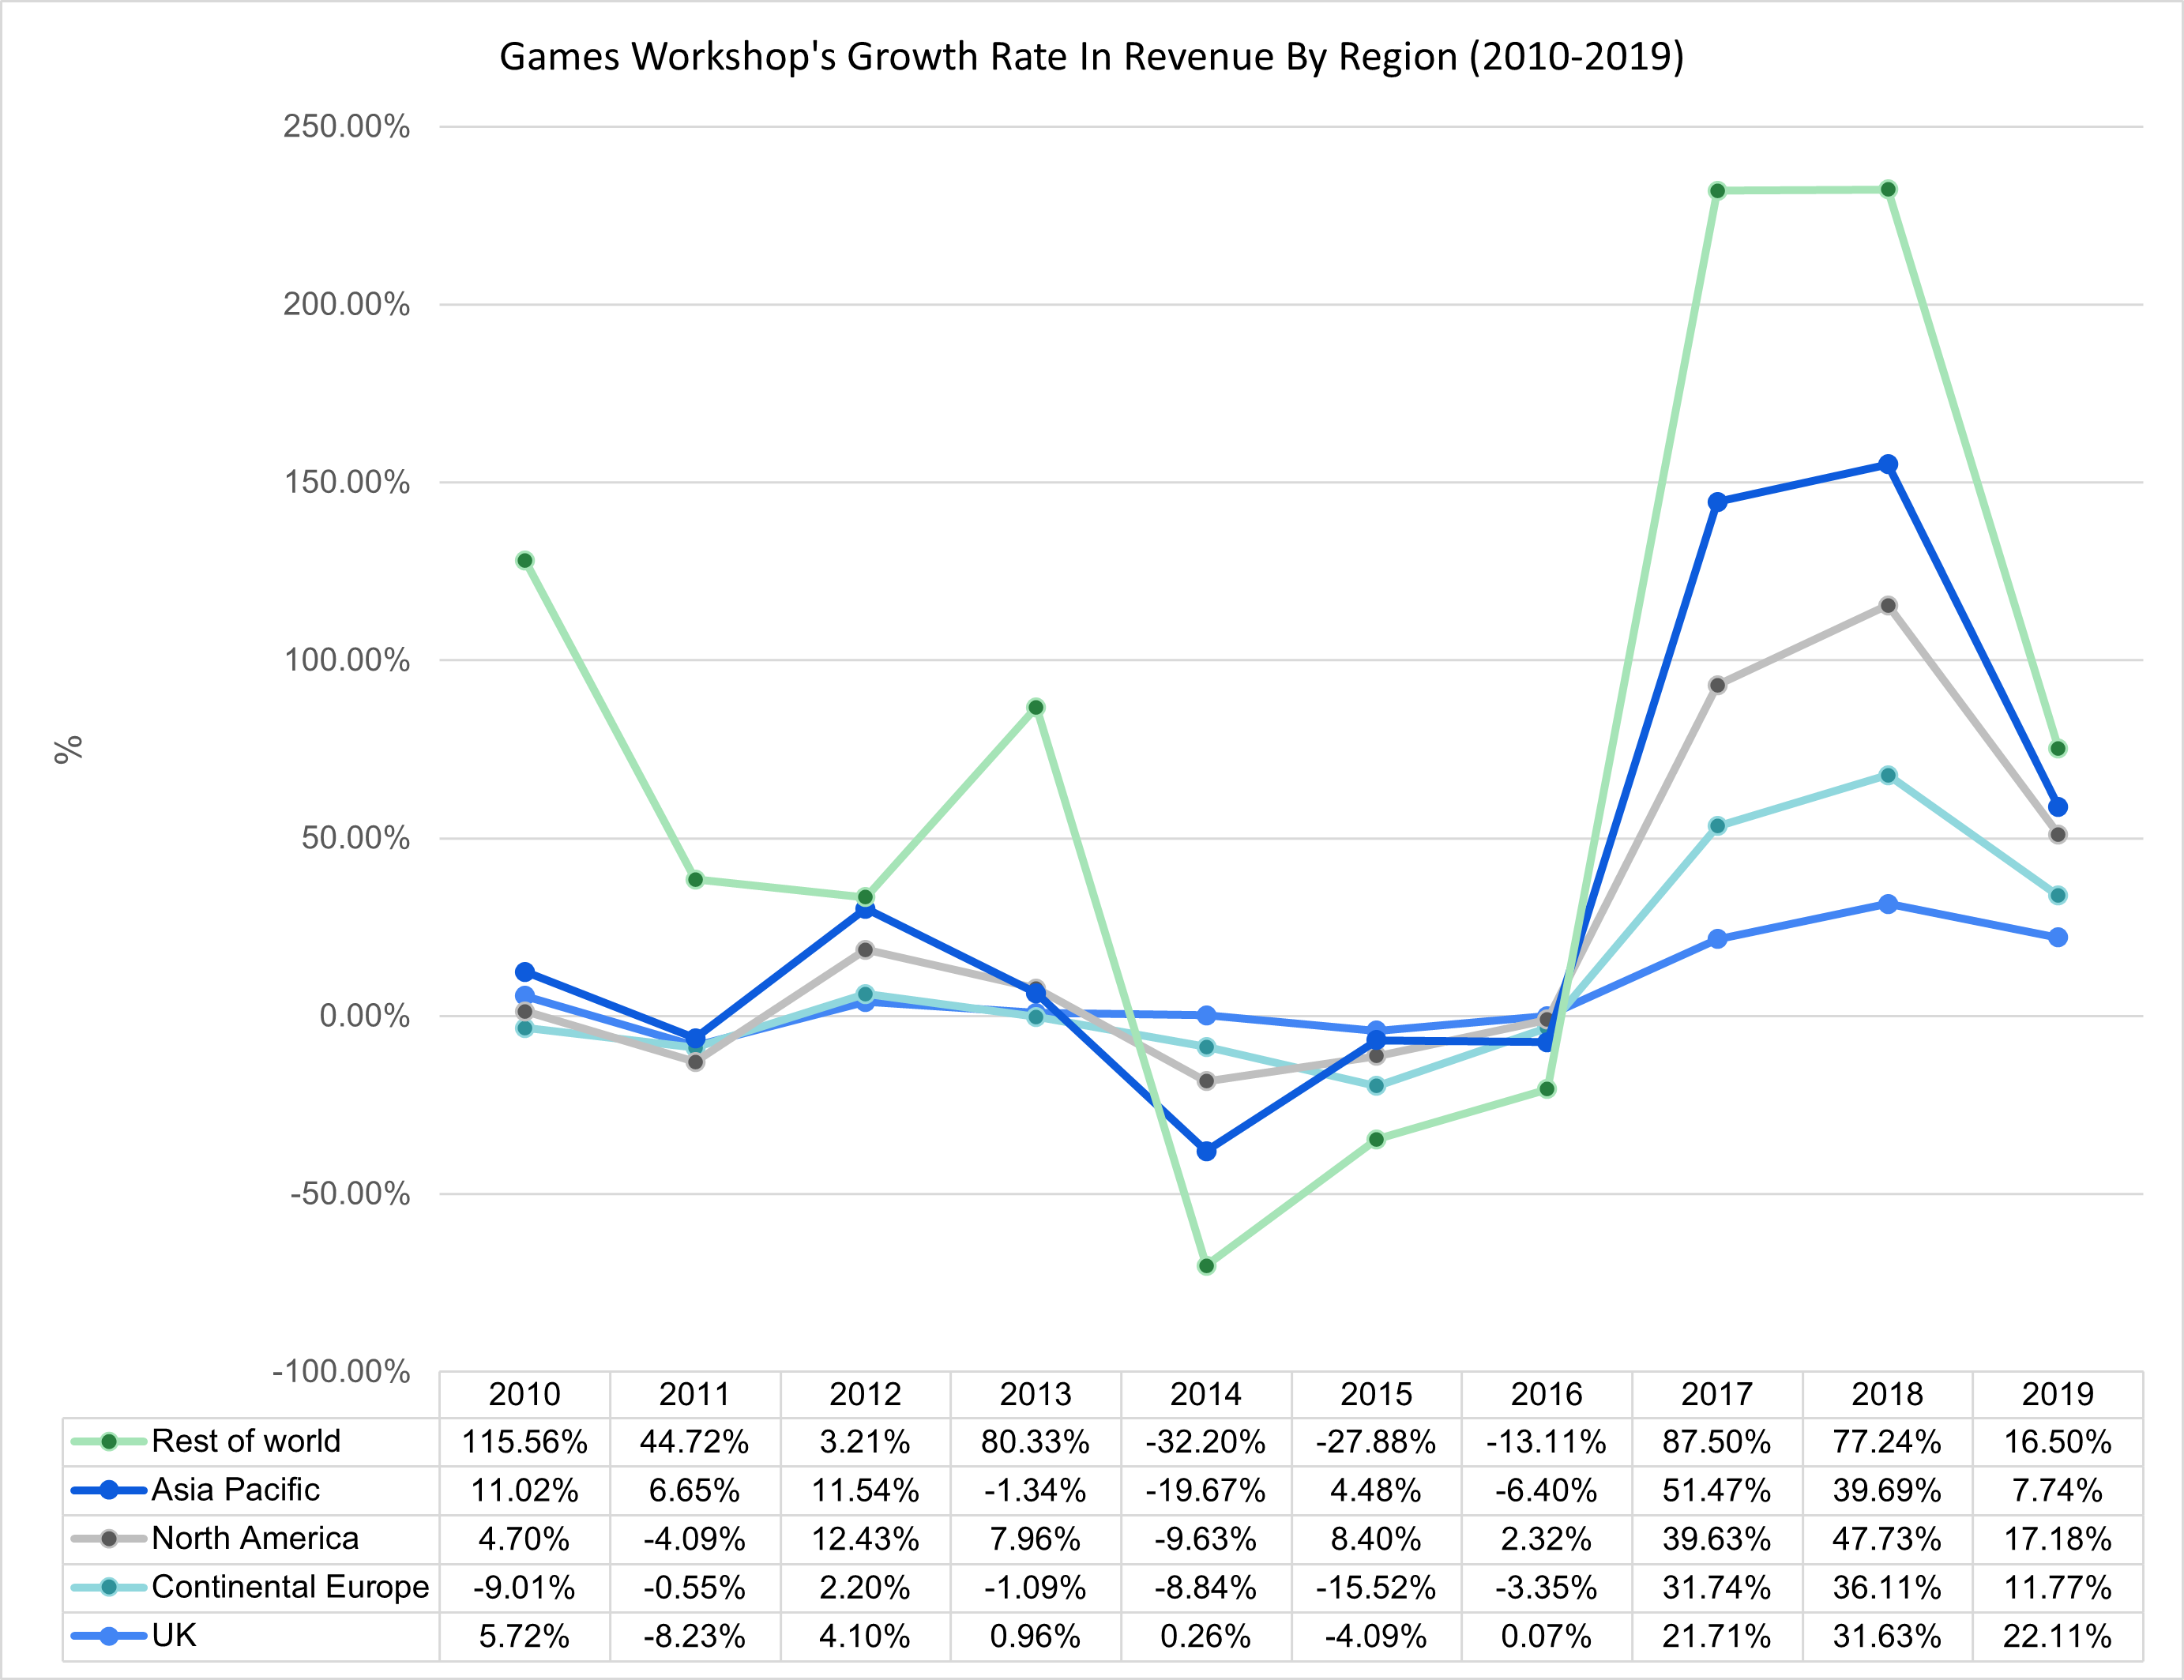
The rest of the world achieved the highest growth rate, which shows that there is a global demand for their products.
However, management has been careful not to stretch too far from their geographic reach. Compared to the other channels, GAW only receives 1% of their revenue from the rest of the world.
There’s also a growing trend in the US and Canadian market. The second highest revenue channel was North America, which generates 37% of GAW’s revenue.
According to a recent data from the Organisation for Economic Co-operation and Development (OECD), United States and Europe had the highest household spending globally while Canada and Ireland had the highest growth in disposable income per household.
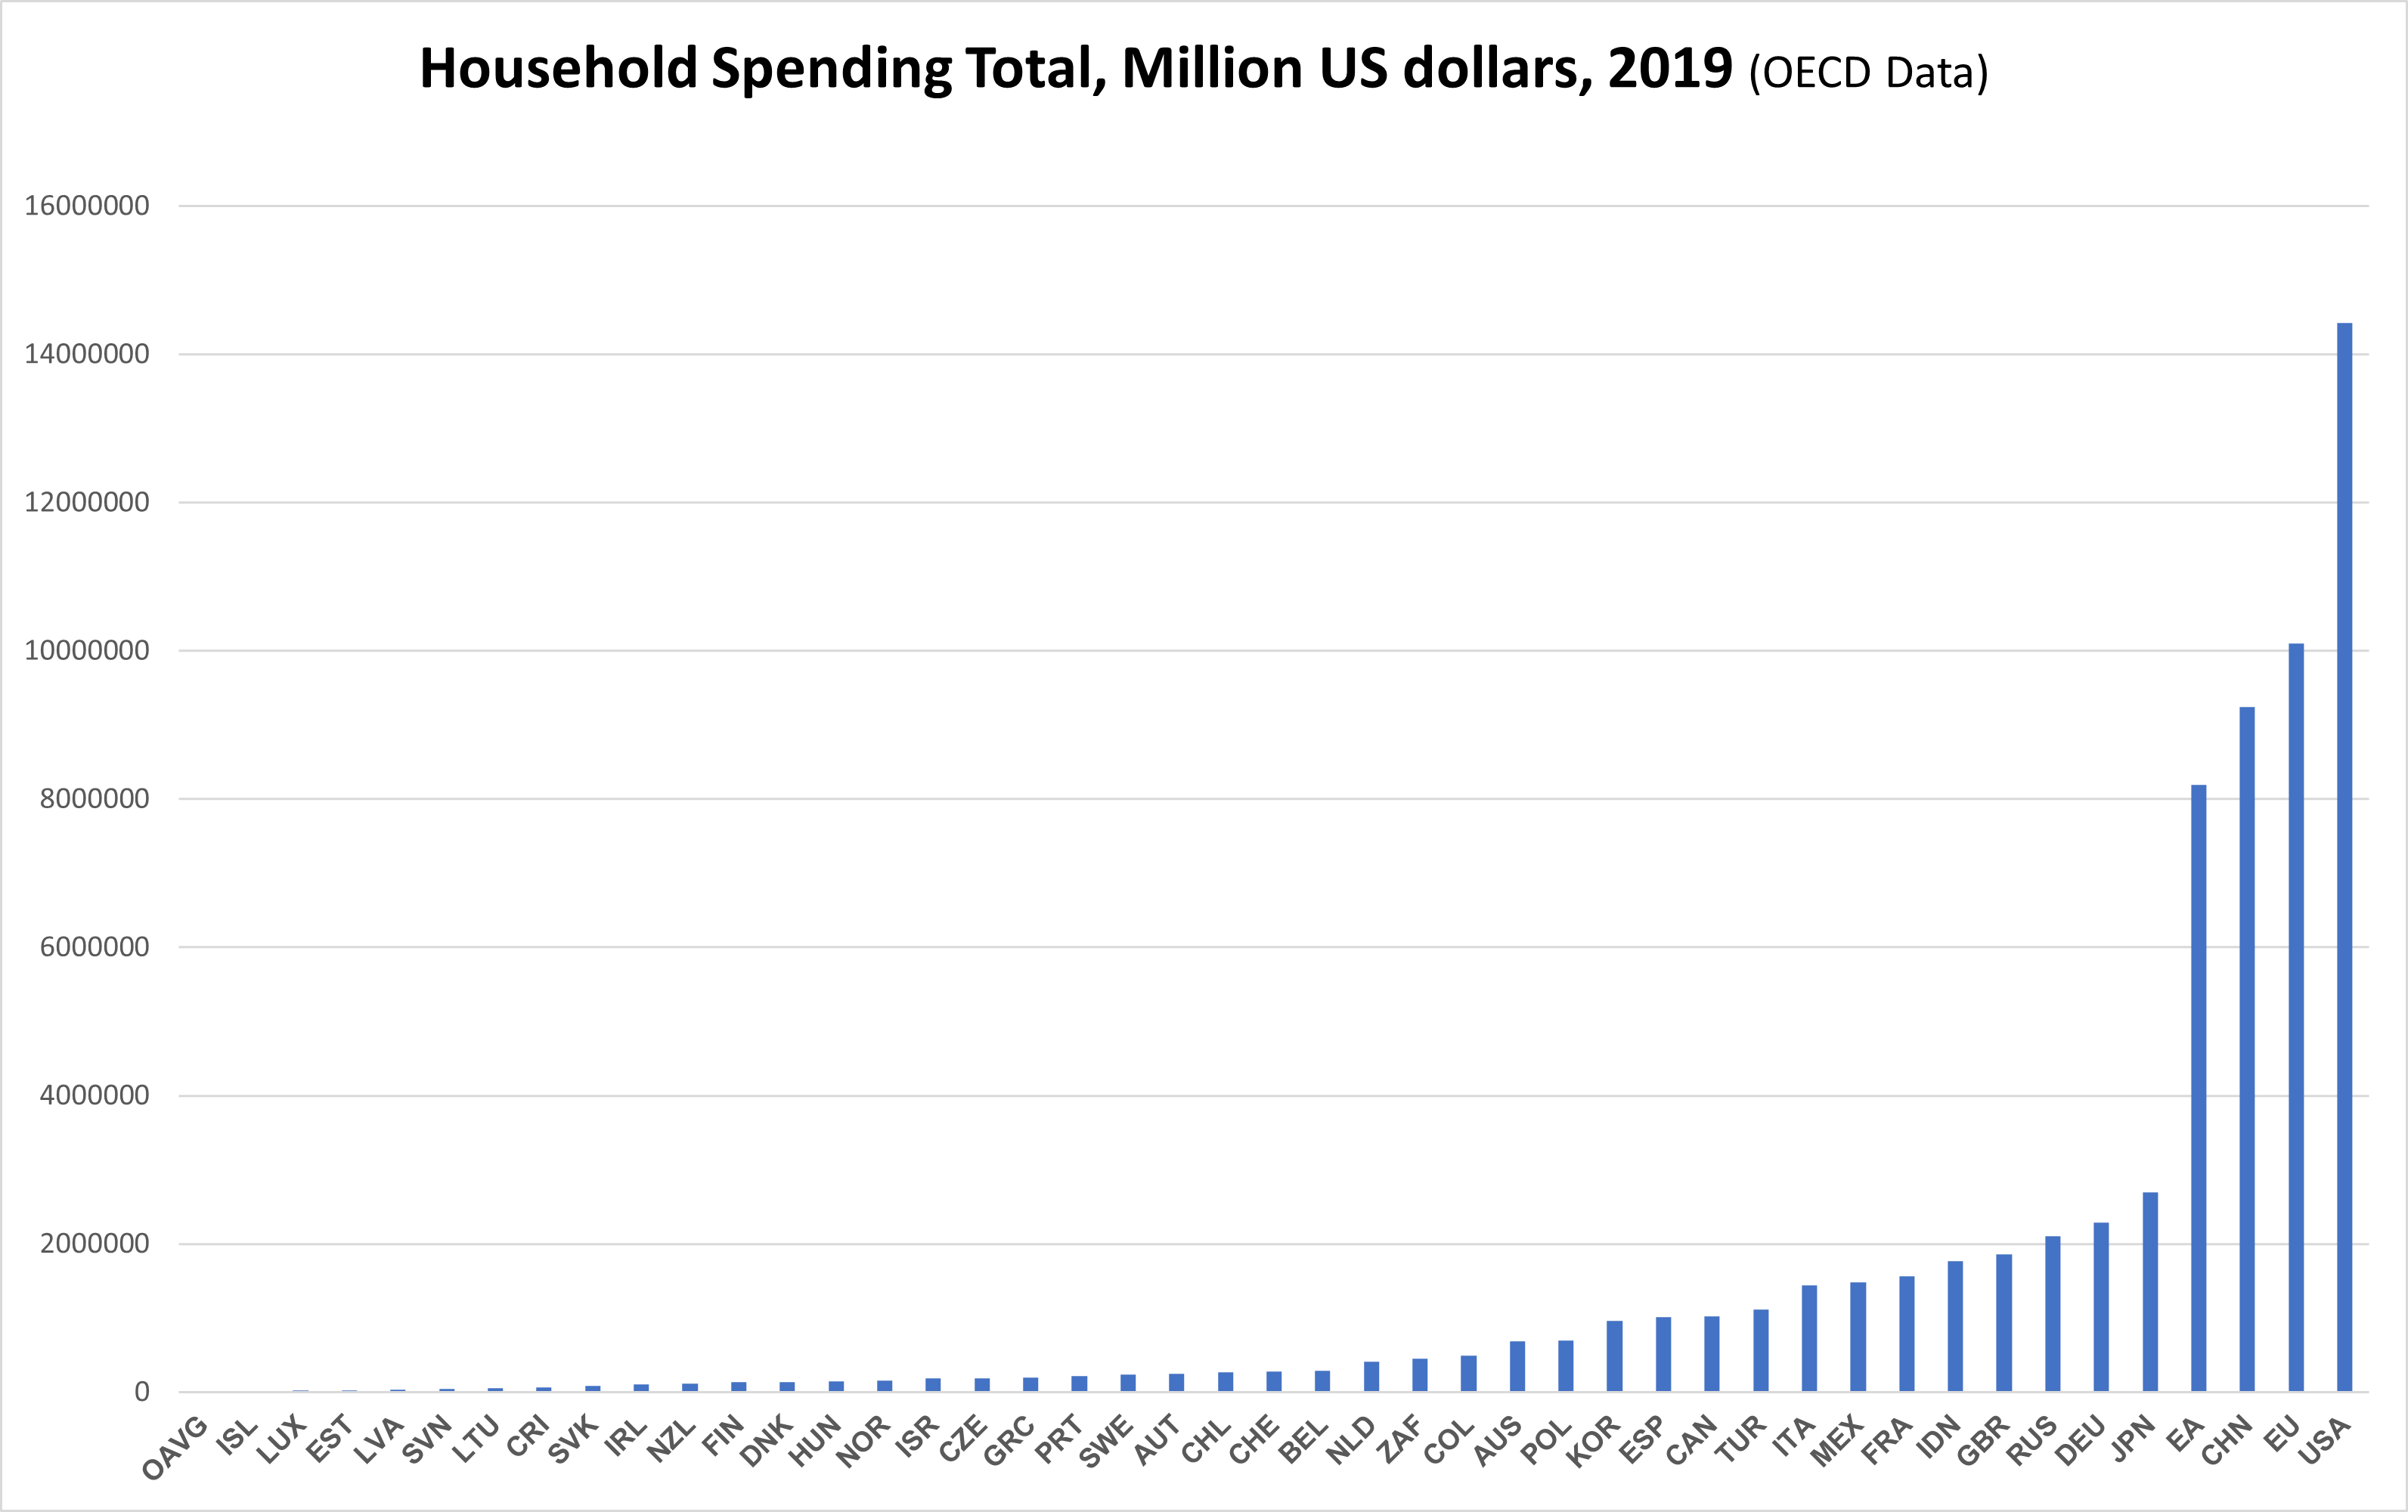
The revenue chart below shows that the company grows within the market they dominate and where their economies of scale carry over.
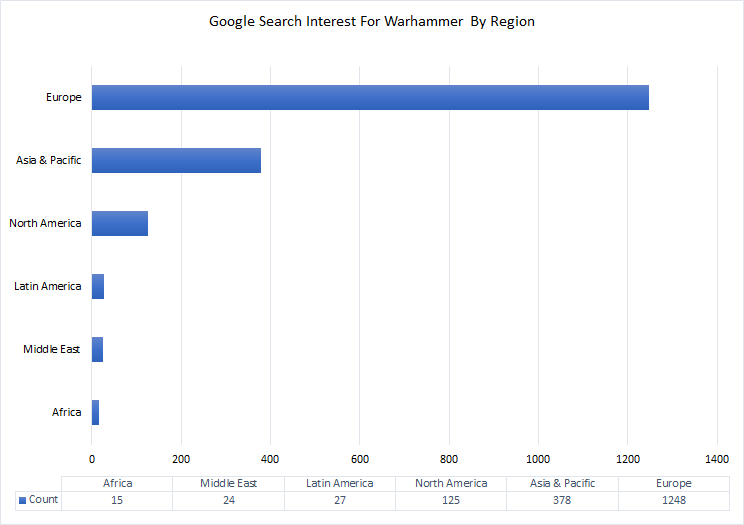
Europe, Asia & Pacific and North America had the highest Google searches for GAW’s core brand, ‘Warhammer’.
The findings align with their strategy and objectives in their financial report, “We continue to believe there are great opportunities for growth, particularly in North America, Germany and Asia.”
Calculating Organic Growth
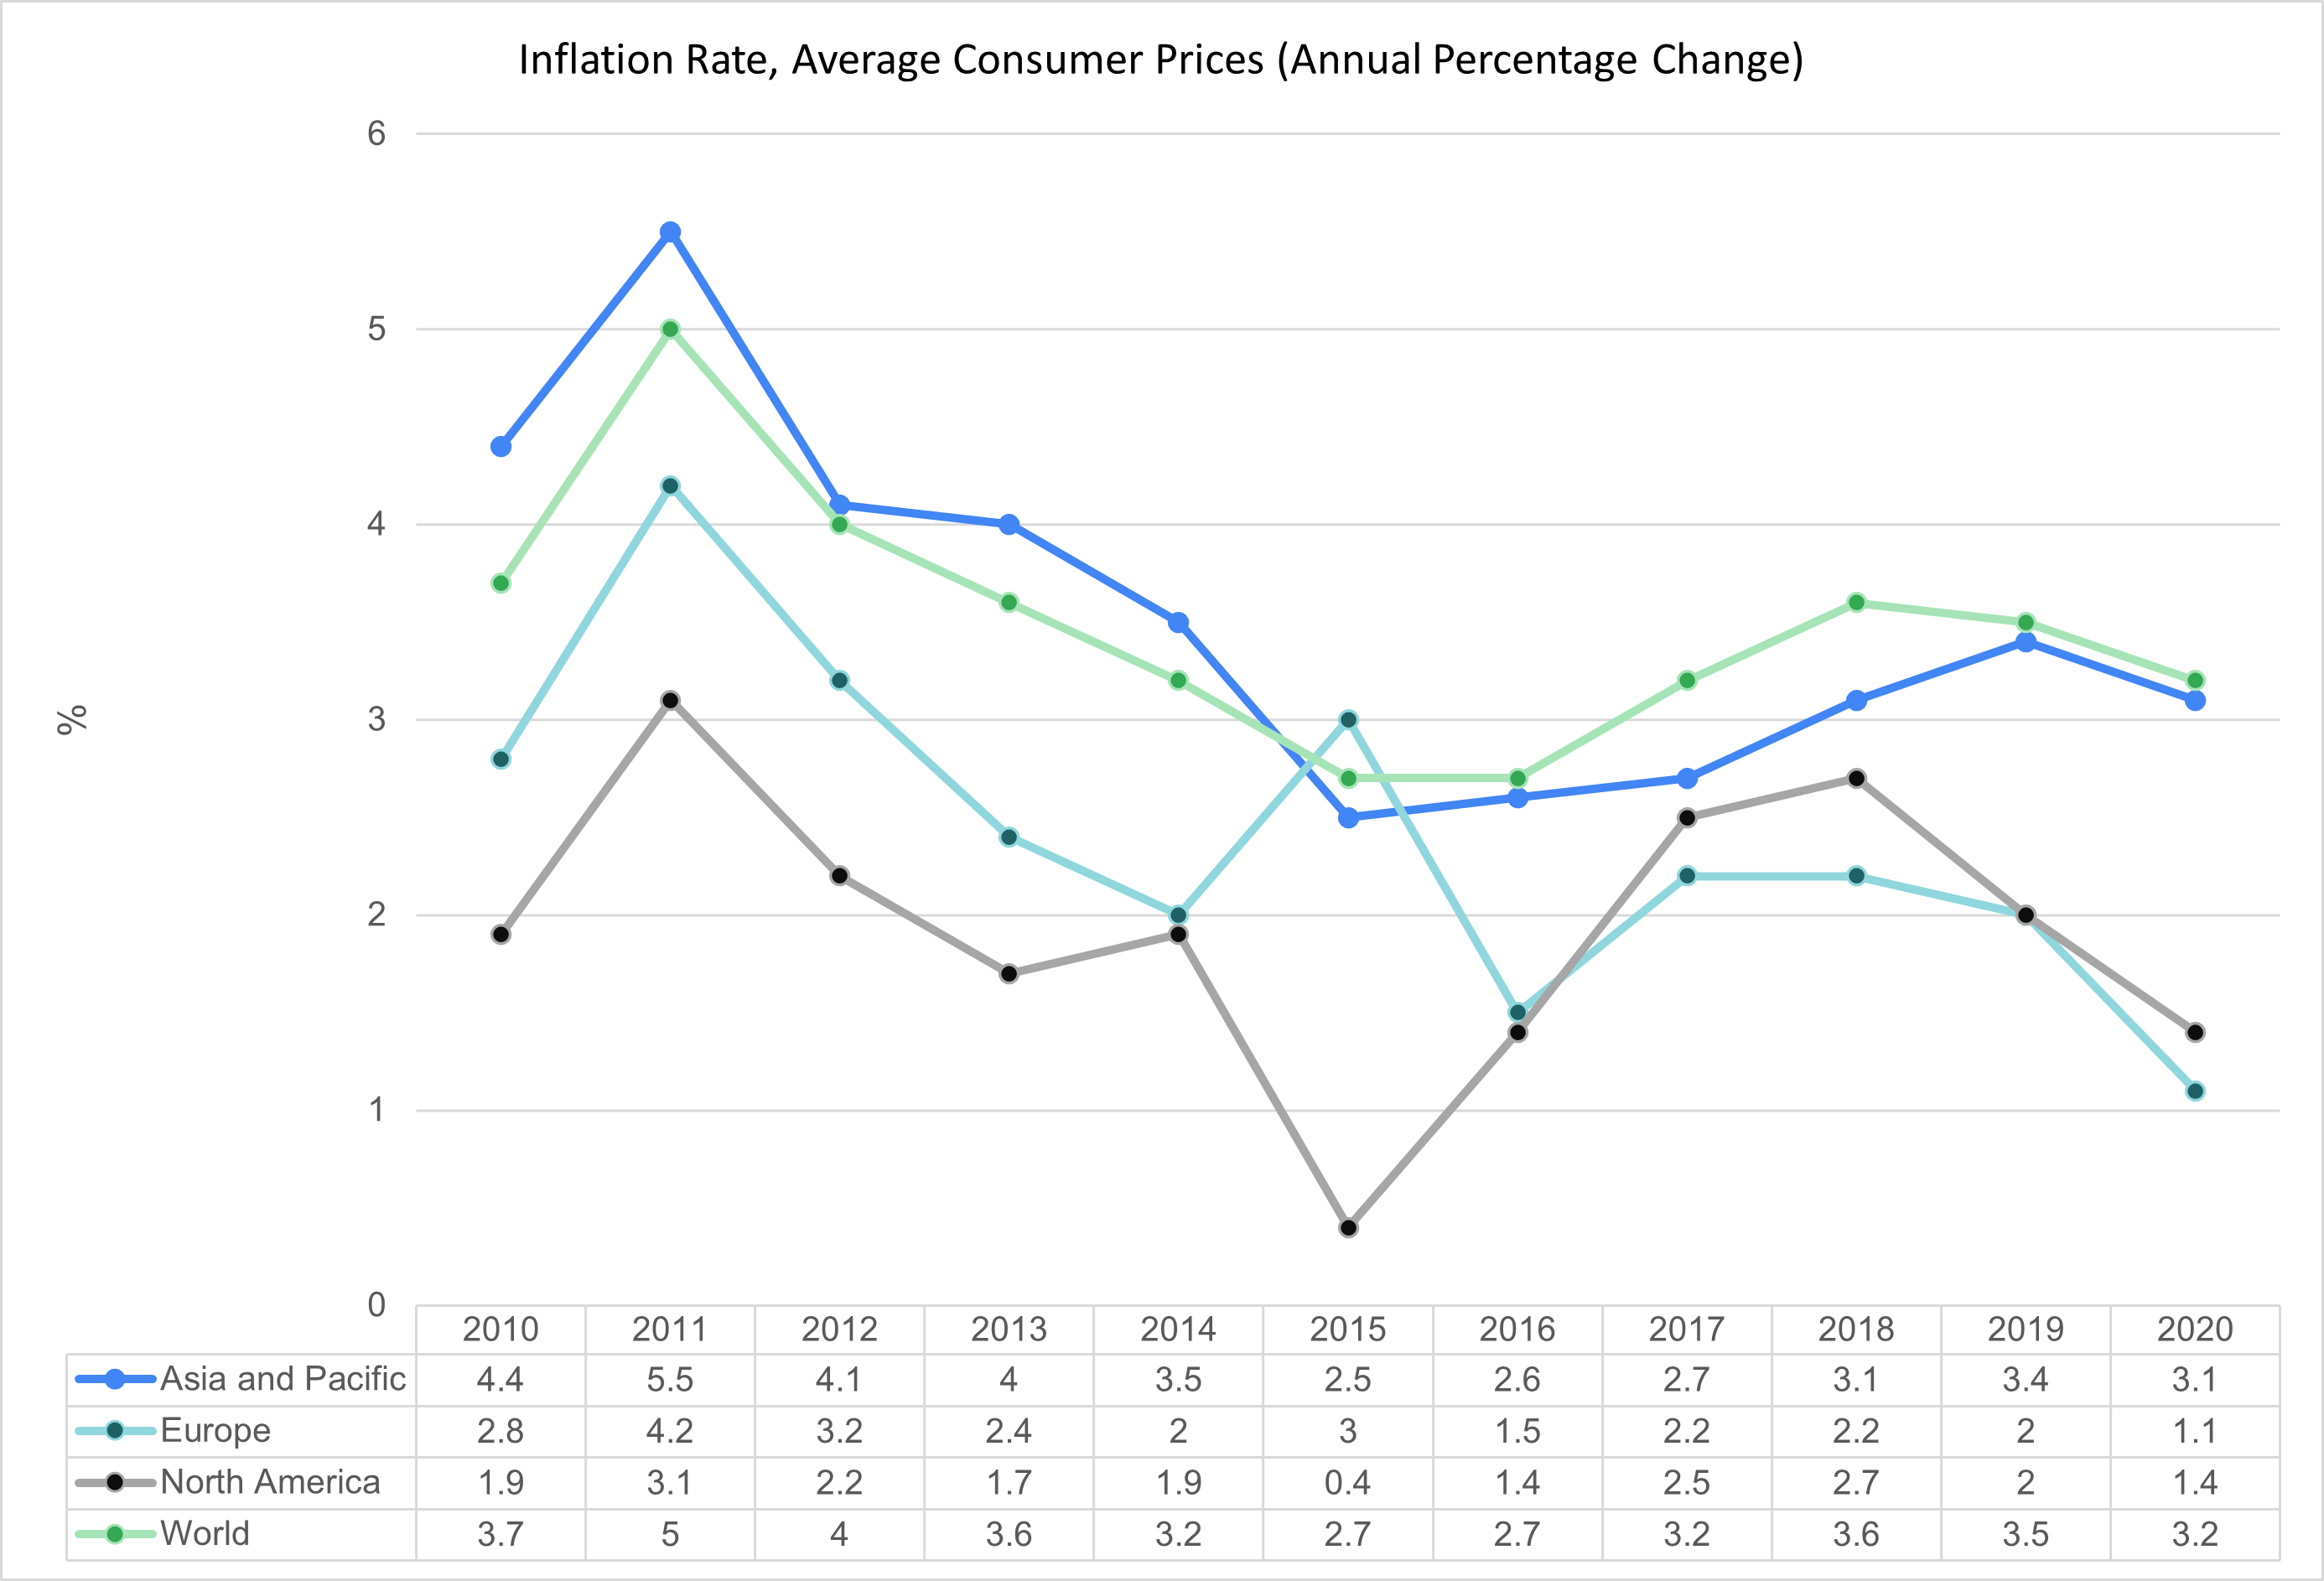
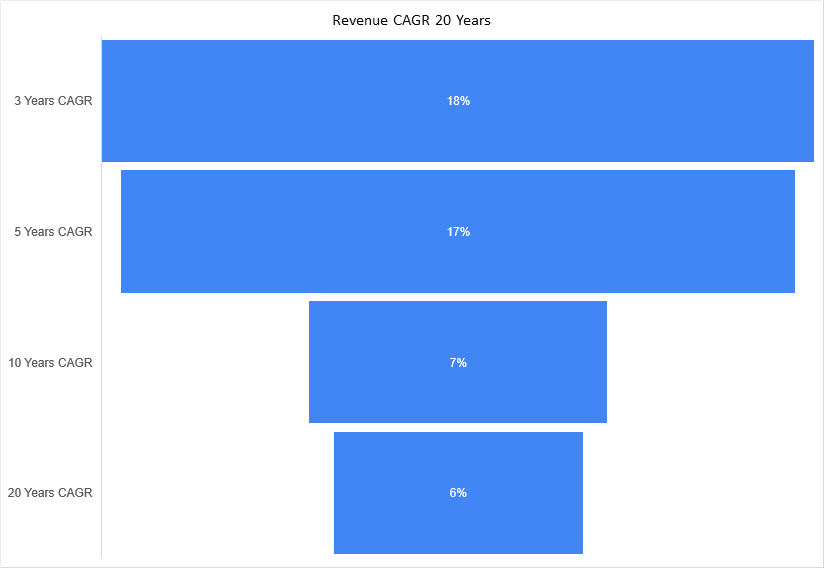
I calculated the compound annual growth rate (CAGR) for the last 20 years (6%) and subtracted it from 2019’s global inflation rate (3.5%) to get their real sales growth (2.5%).
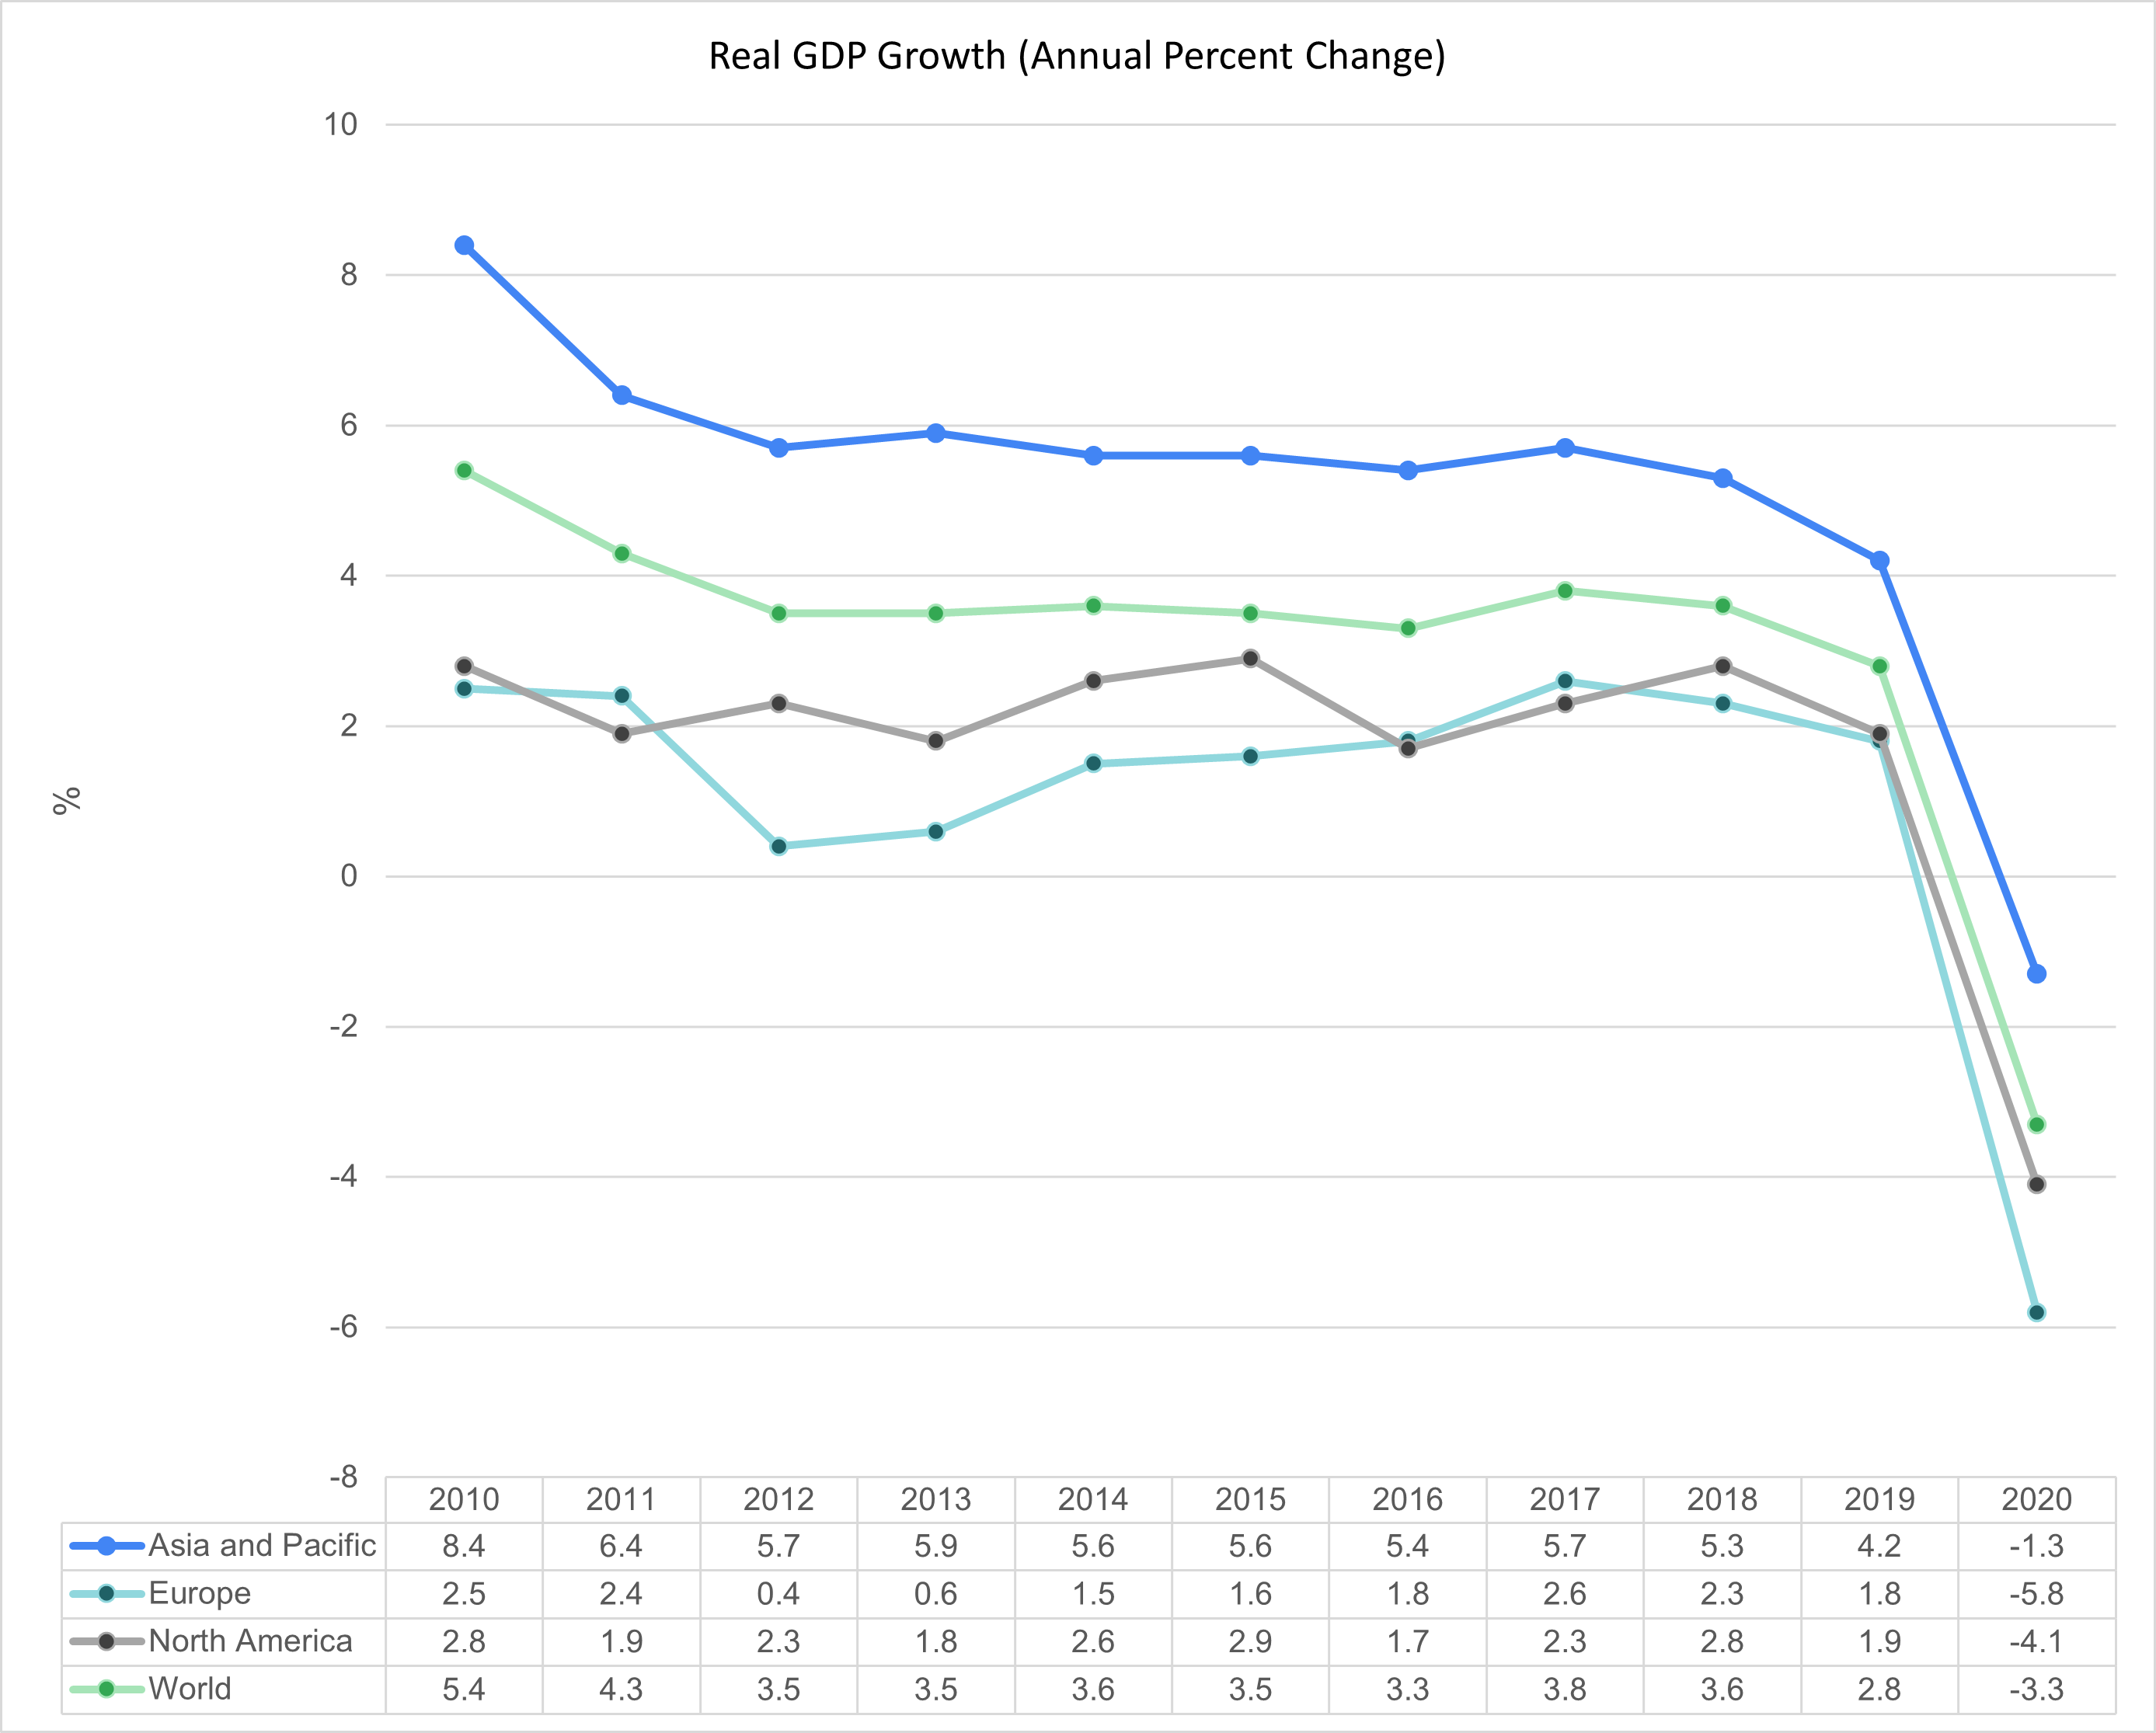
Real Sales Growth = 6%-3.5% = 3%Growth rates rarely move above 3% or 4% of GDP in the long term because it is not sustainable. In theory, return derives from productivity of the economy hence, long-term returns cannot exceed the GDP of the underlying economy.
If GDP exceeds more than 4%, economic growth will stall and this will be followed by a period of contraction, where businesses will hold off on recruiting and investing.
The reason for using the world inflation rate as opposed to the local rate is because GAW’s trading partners, revenue stream and distribution networks are global.
UK market accounts for only 26% of their revenue. Therefore, changes in economic activity outside the UK can affect their revenue stream.
In 2020, I made several assumptions prior to choosing the historical growth rate. I expect GAW’s growth rate to increase above the global level in the short-term and steadily go back to 3-4%, post-covid lockdown.
This will be fuelled by an increase in disposable income accumulated from remote working and reduction of travel and outdoor leisure. There will be an increase in online activities, with customers exploring new hobbies and forming social connections and communities.
There will also be an increase in online spending. However, this will gradually normalise as physical shops, travel and outdoor activities increase.
The five year historical average for account receivables and inventories to sale was 16% (£0.16). I subtracted trade and other payables to sale 10% (£0.10) to get a net working capital of 6% (£0.06).
Net Working Capital = 16%-10% = 6%The company’s revenue for 2019 was £256.6 million, with 2.5% in growing sales (£6.4 million).
Growing Sales in Revenue = 256.6m*2.5% = 6.4mThe additional net working capital required for GAW was £0.6 million. I multiplied the growing sales in revenue by the networking capital.
The additional net working capital is the amount GAW will need to generate growing sales, at a 6% growth rate to support the day-to-day operations.
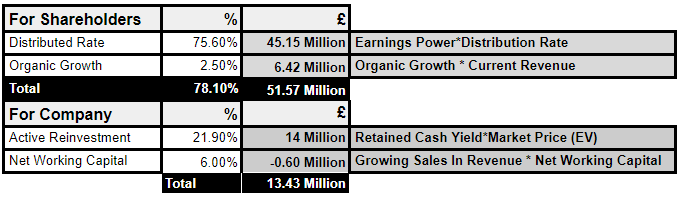
Additional Networking Working Capital = 6.4m*6% = 0.38mNearly three quarters of earnings will continue to be distributed to shareholders and 2.5% will be needed to support organic growth. The remaining 21.9% (100% - 78.1%) is for active reinvestment.
The additional networking capital will come out of the retained earnings. I subtracted net working capital (0.6 million) from the active reinvestment, which resulted to13.43 million.
Active Reinvestment
To calculate management’s capital allocation through active investment, I need to know:
GAW’s active reinvestments
Retained earnings that are being ploughed back into the business
Since 2010-2019, GAW did not make any large acquisitions. The investments were used to purchase new facilities, improve on existing infrastructure, expand operations and product line.
It is challenging to value active reinvestment without making an error of judgement with intangible assets. Most of the crucial inputs from intangible assets are not explicitly highlighted on the financial statement.
For instance, expenditures on R&D, new acquisitions, enhanced operational efficiency in accounting are not treated as an investment but an expense.
However, there is a workaround for identifying these hidden assets. A quick approach is to spot areas where there are elevated levels of spending on intangible assets, operating expenses, or R&D. This will be accompanied by a higher than average growth rate and a steady increase in earnings or returns.
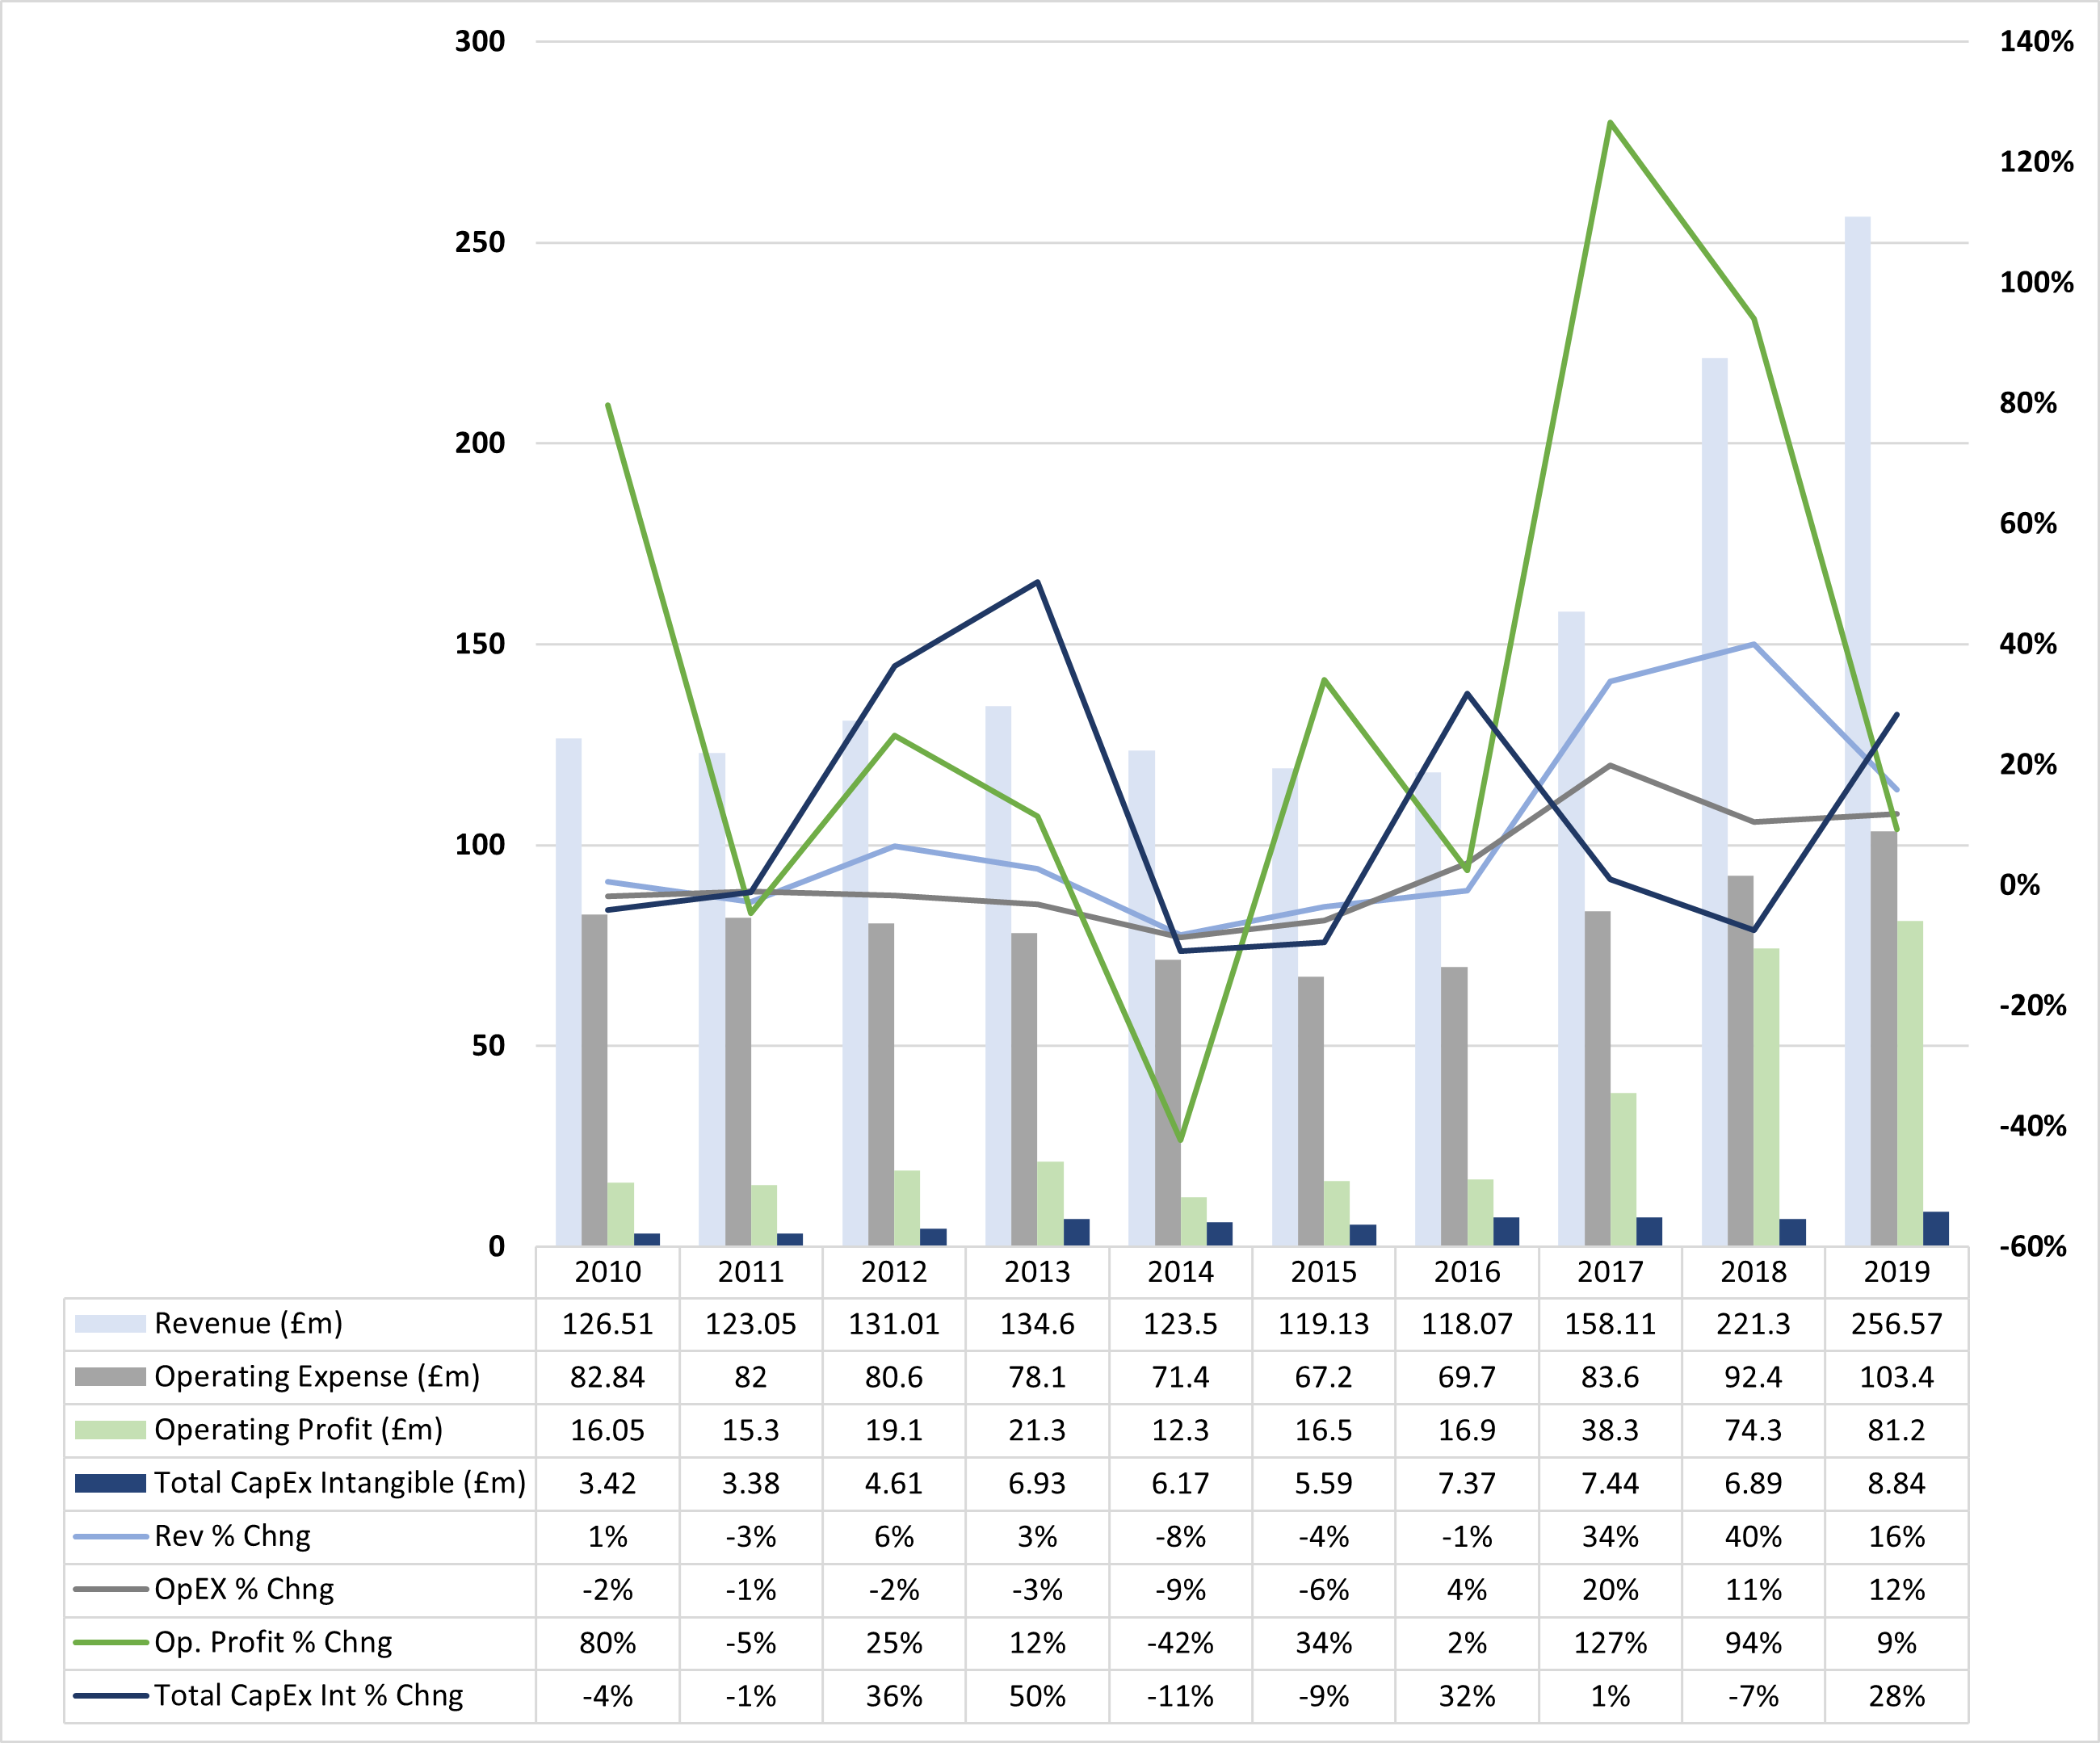
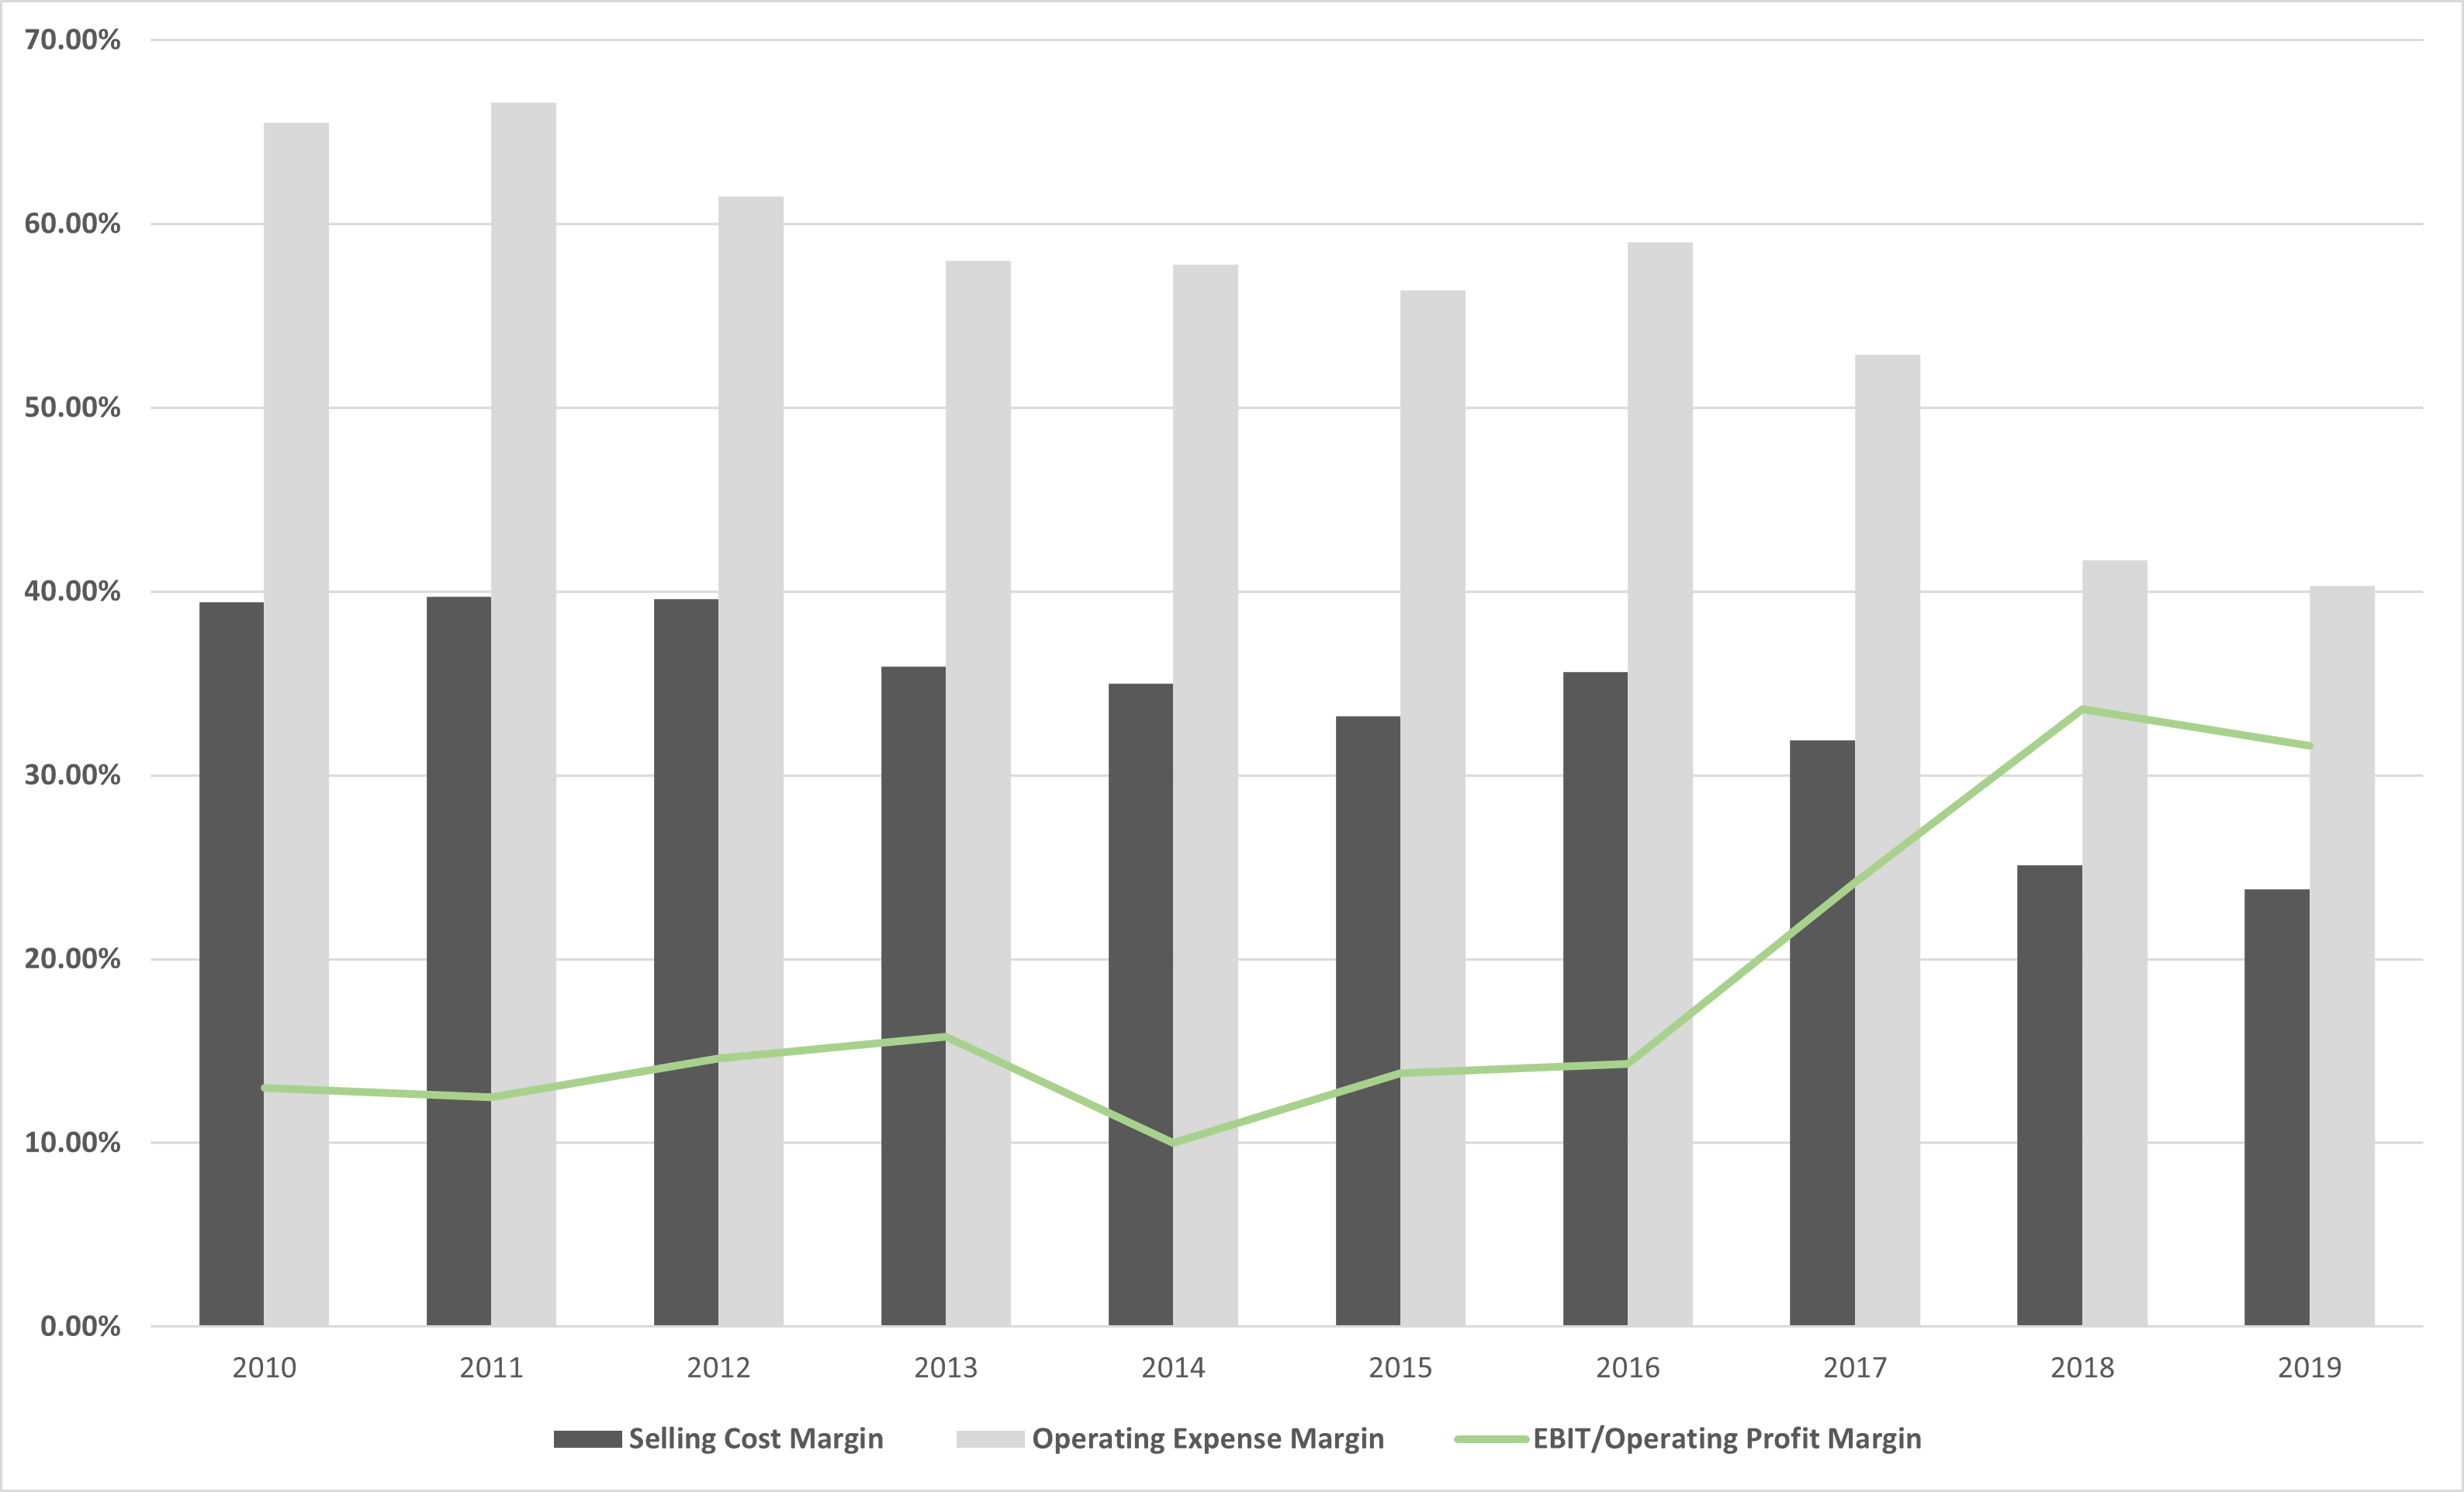
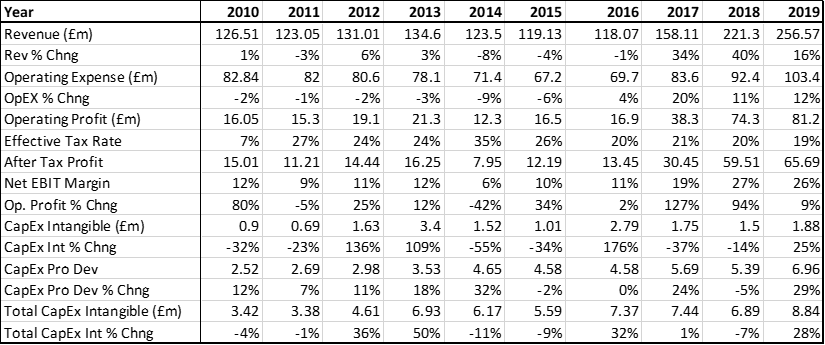
The chart above shows high percentage changes in capital expenditure on intangibles in 2016, resulting in a higher than average growth rate in revenue and operating profit.
This contrasts with prior years’ changes in intangible expenditure, which had little impact on revenue and profit. Operating expenses also increased in 2017, compared to previous years.
Though an operating expense and intangible expenditure increase may be one aspect of the steady rise in income, operational efficiency is another.
The Dupont analysis chart is a decomposition of GAW’s return on investment and the drivers fuelling their growth.
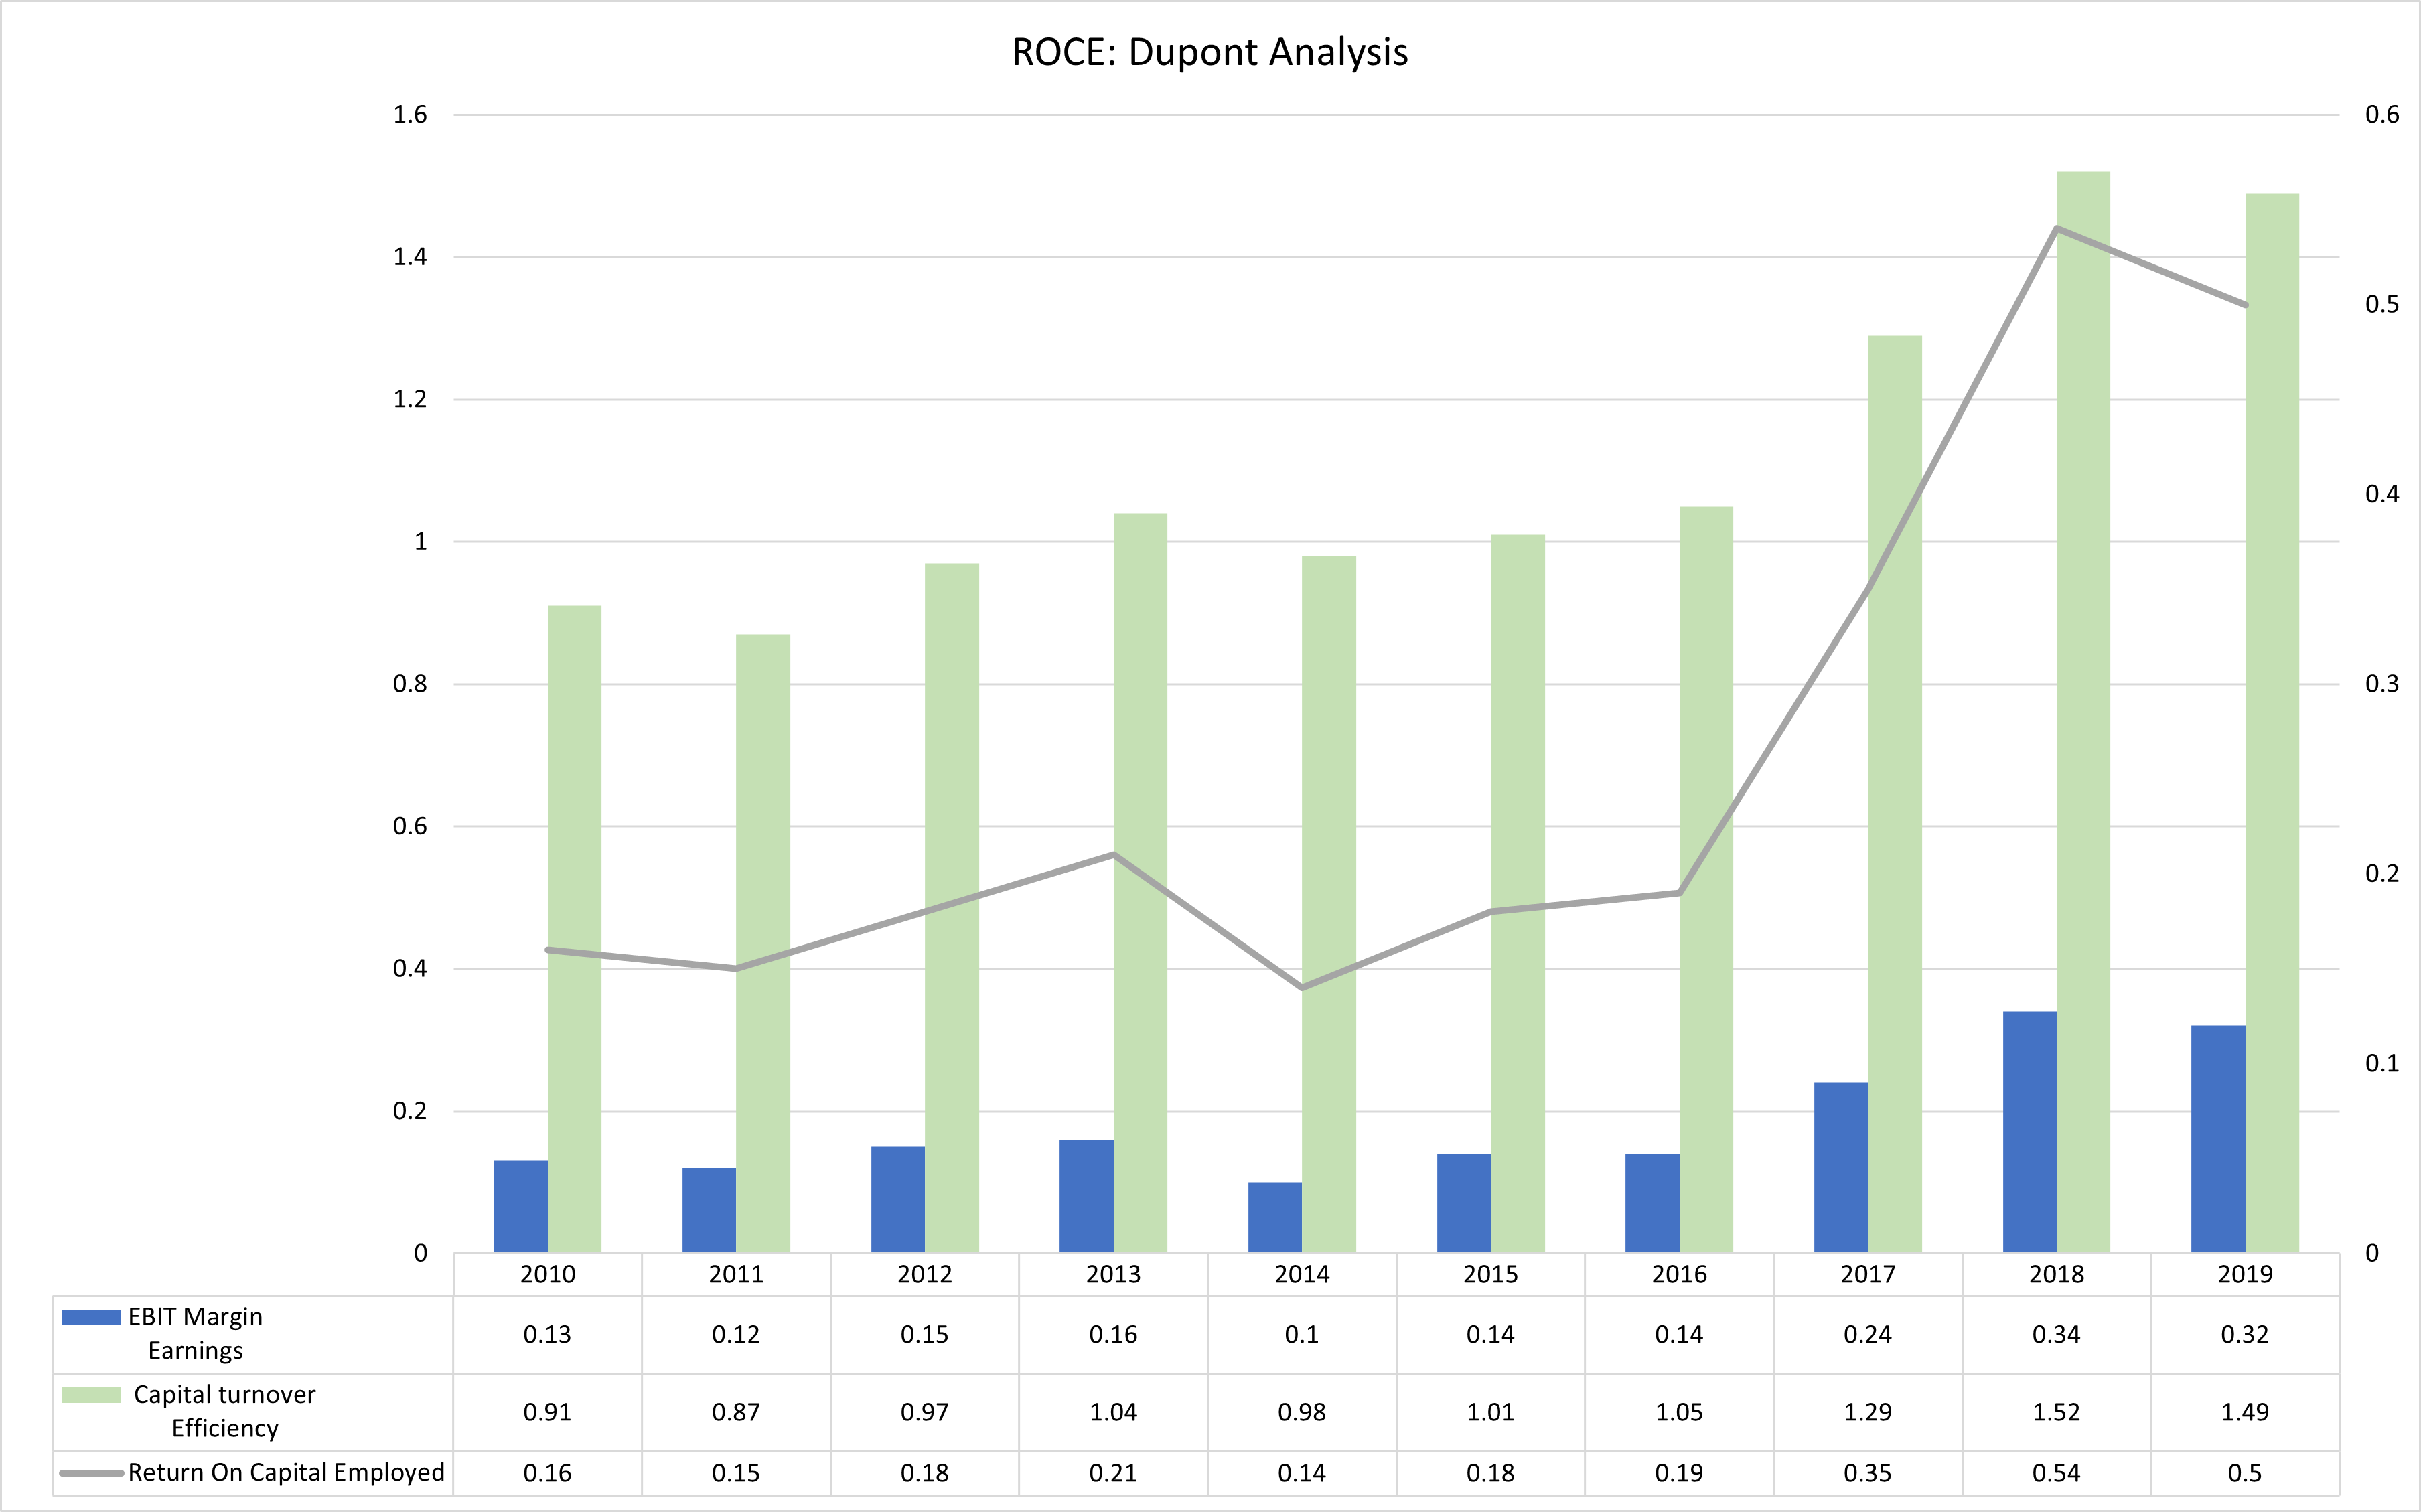
The results in both charts show a high rise in asset and capital turnover, which suggests that GAW is using less asset to generate more income.
High asset turnover is usually accompanied by low profit margin in the retail sector because of intense competition.
However, GAW’s profit margin has steadily been increasing since 2016 because of economies of scale.
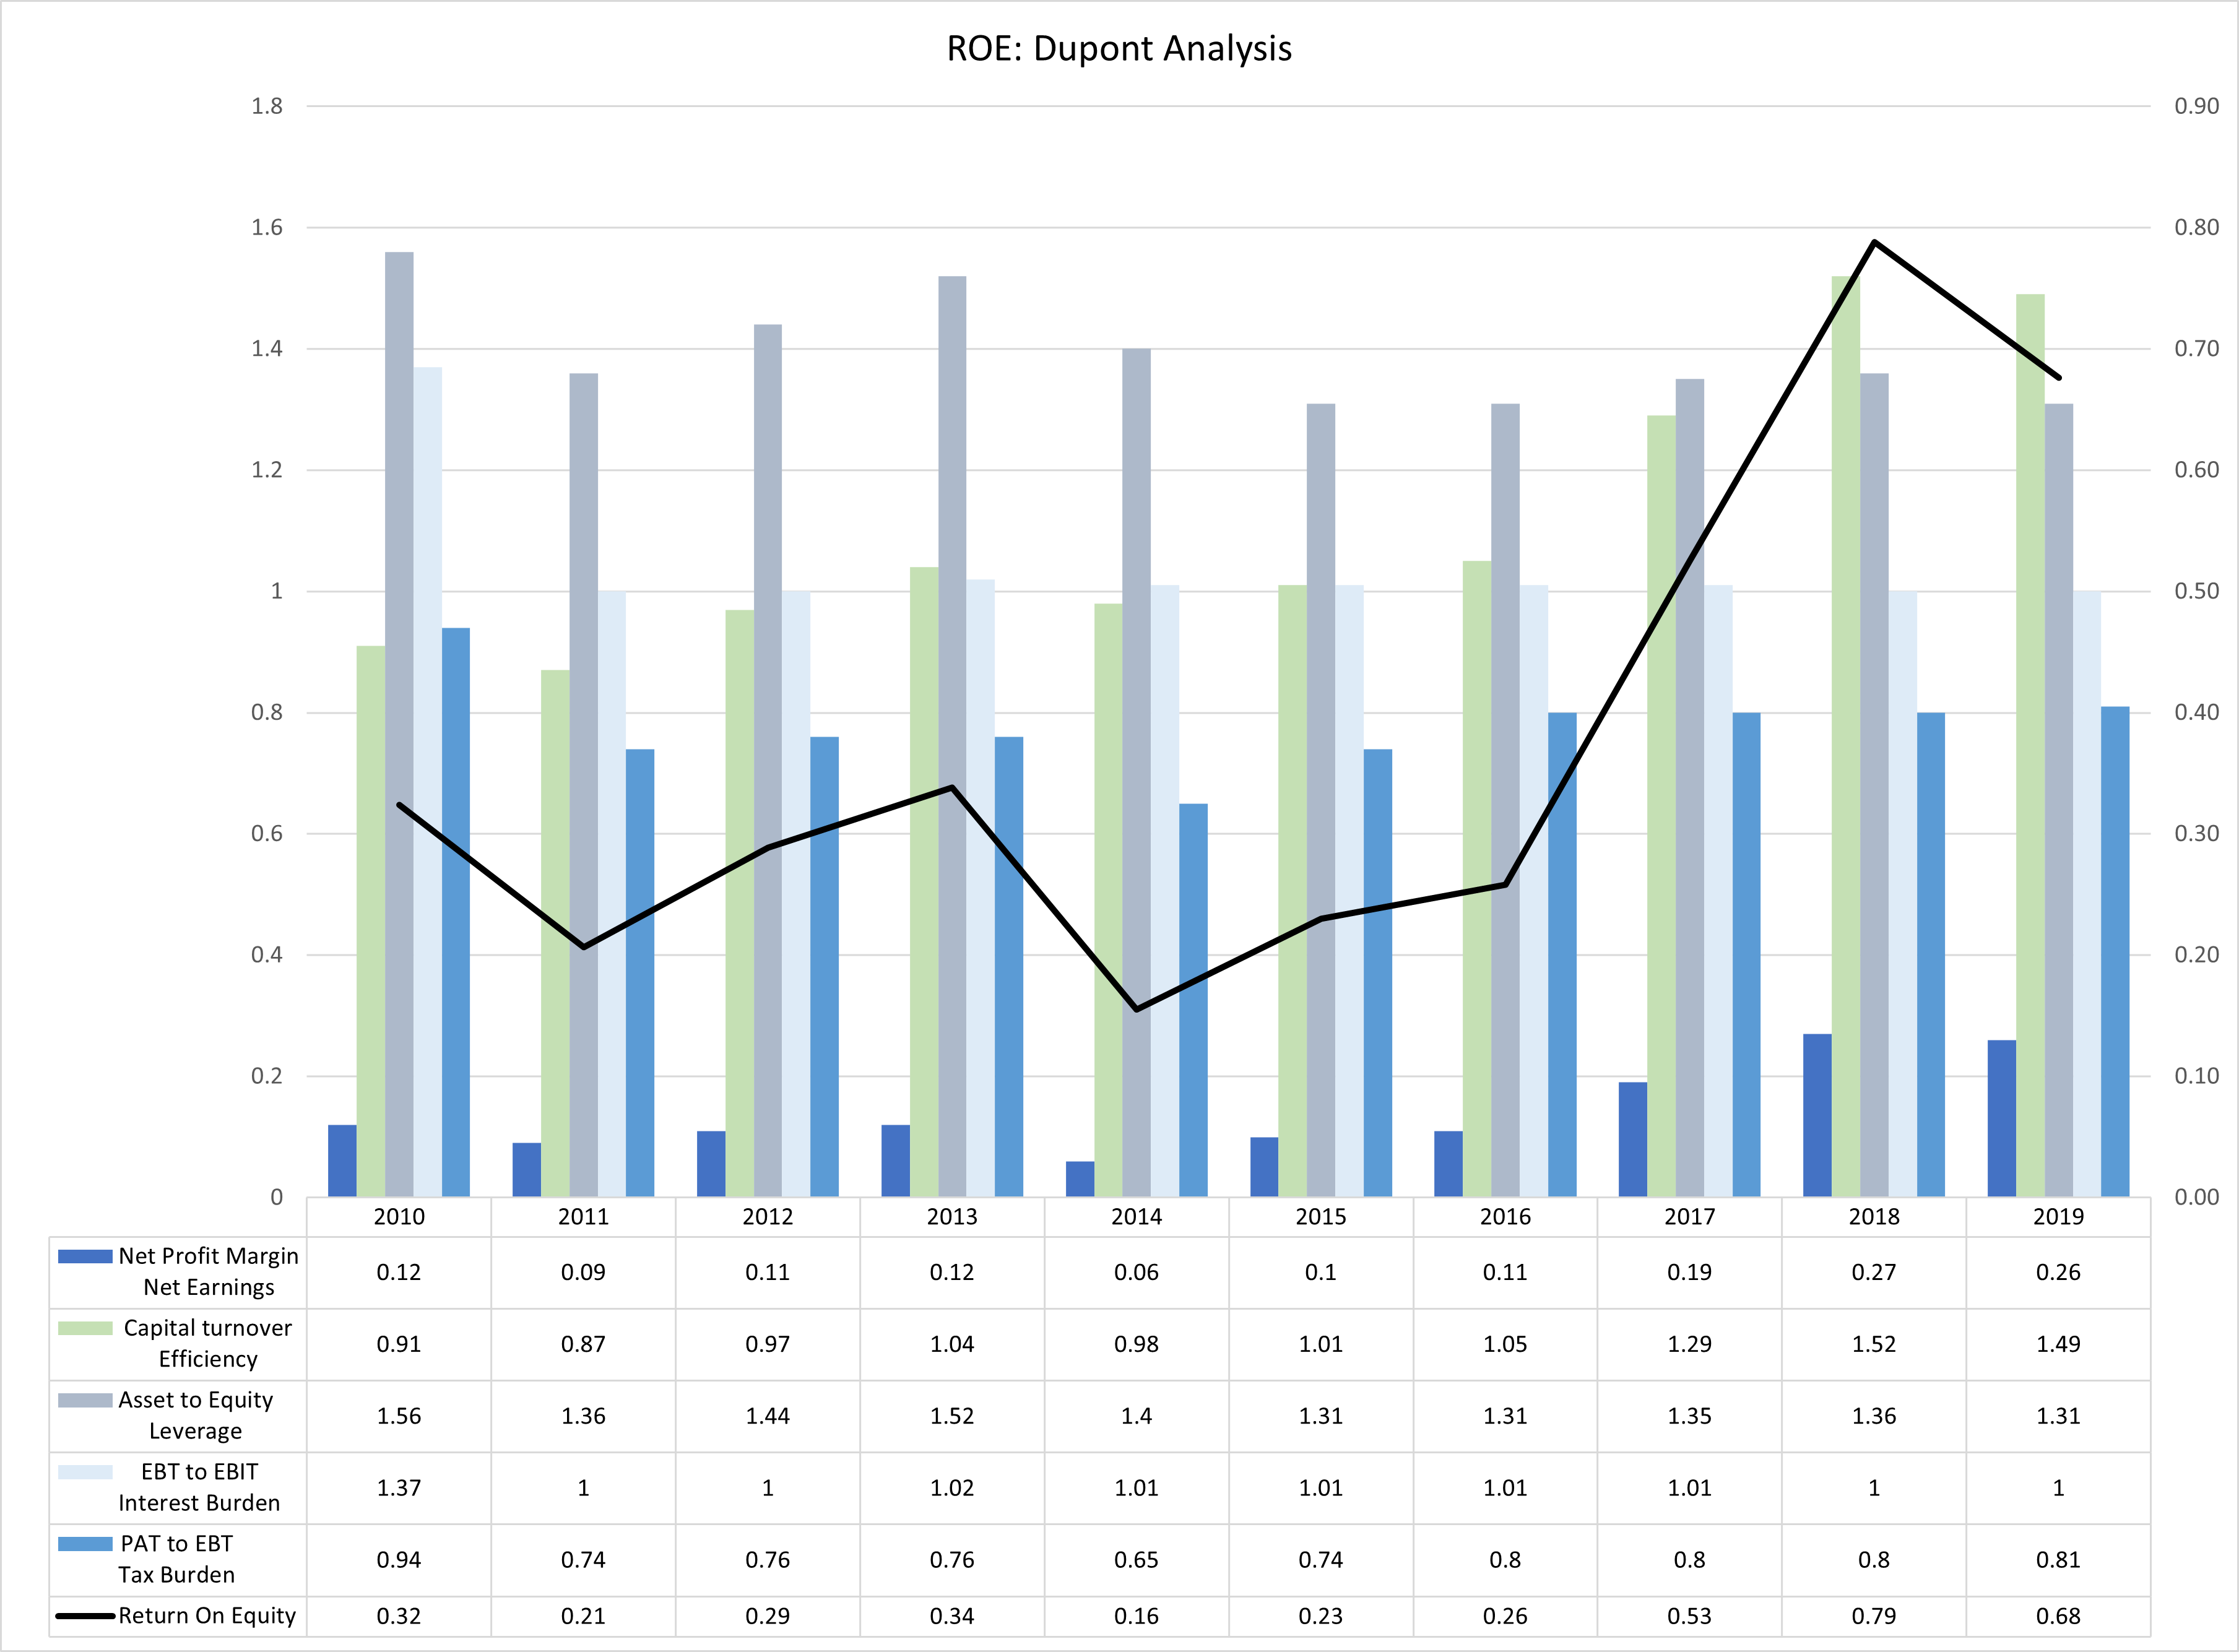
The equity-based Dupont chart shows a steady reduction in leverage between 2013 to 2016, while the following years show an increase in operational efficiency.
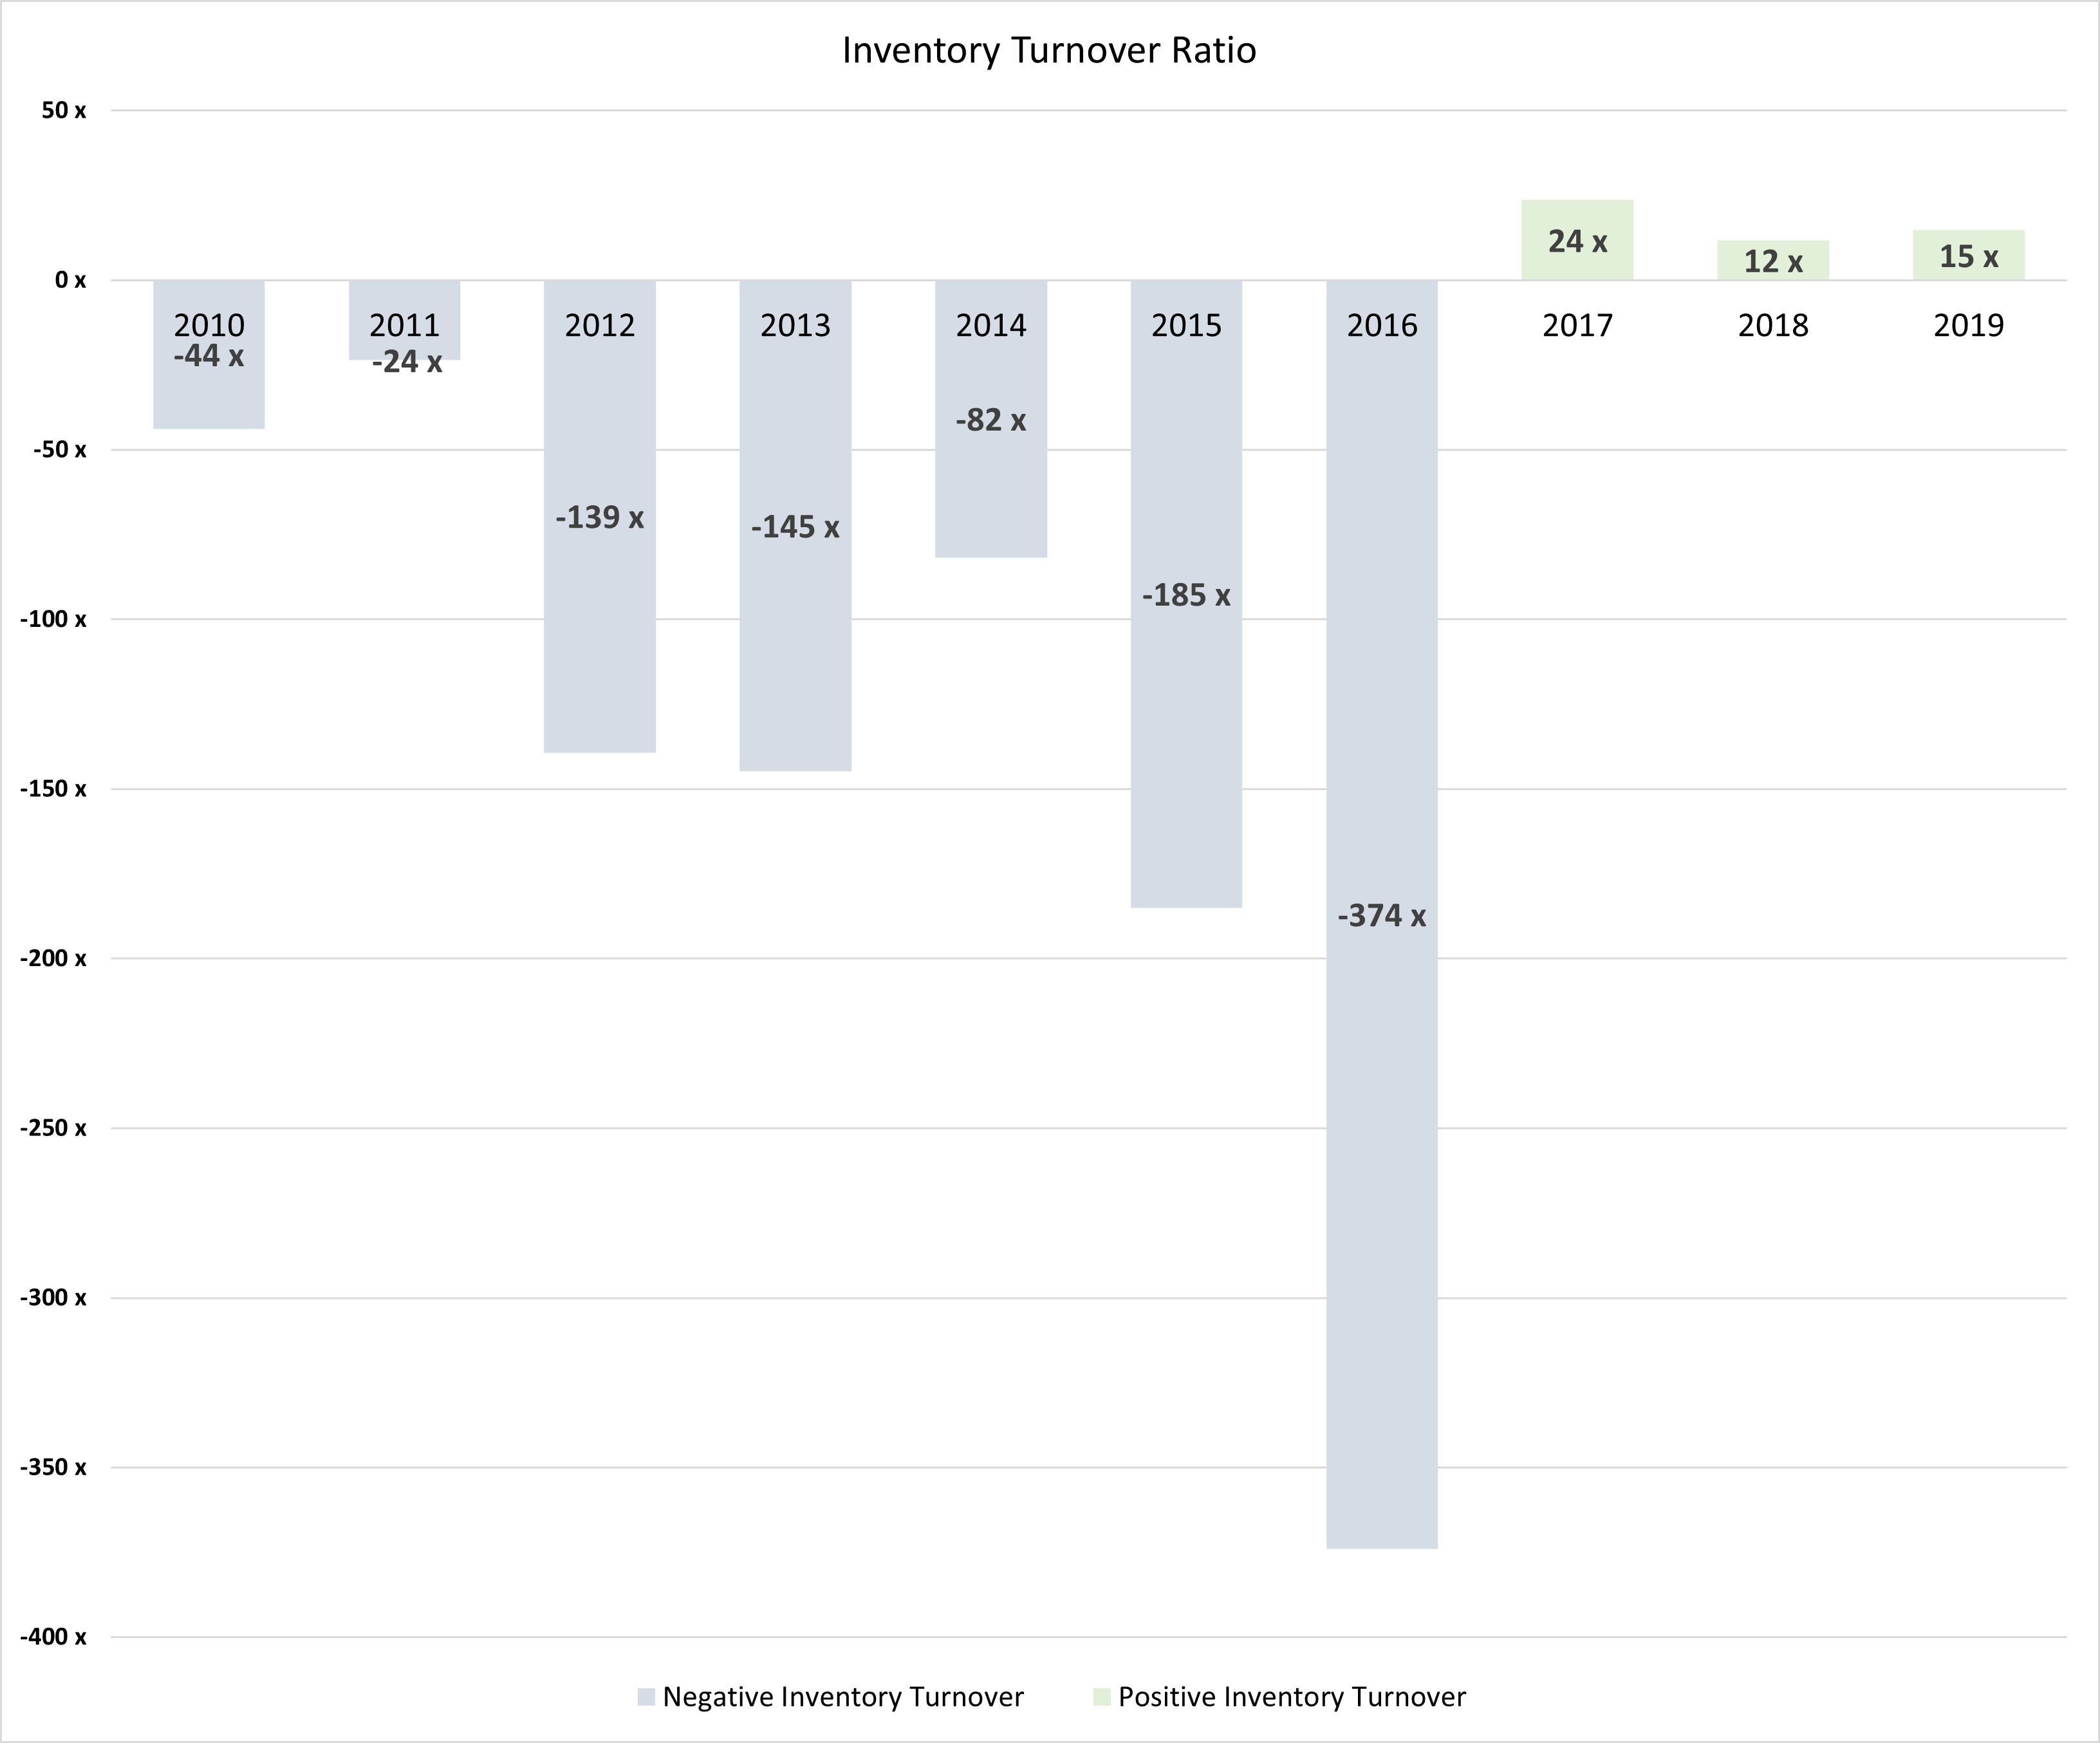
Prior to 2017, GAW was piling up more stock in their warehouse. The inventory turnover ratio shows the excessive levels of unsold goods compared to sales.
Their 2016’s results also show that the company was selling 374 times less than expected and prior years’ velocity was no better either.
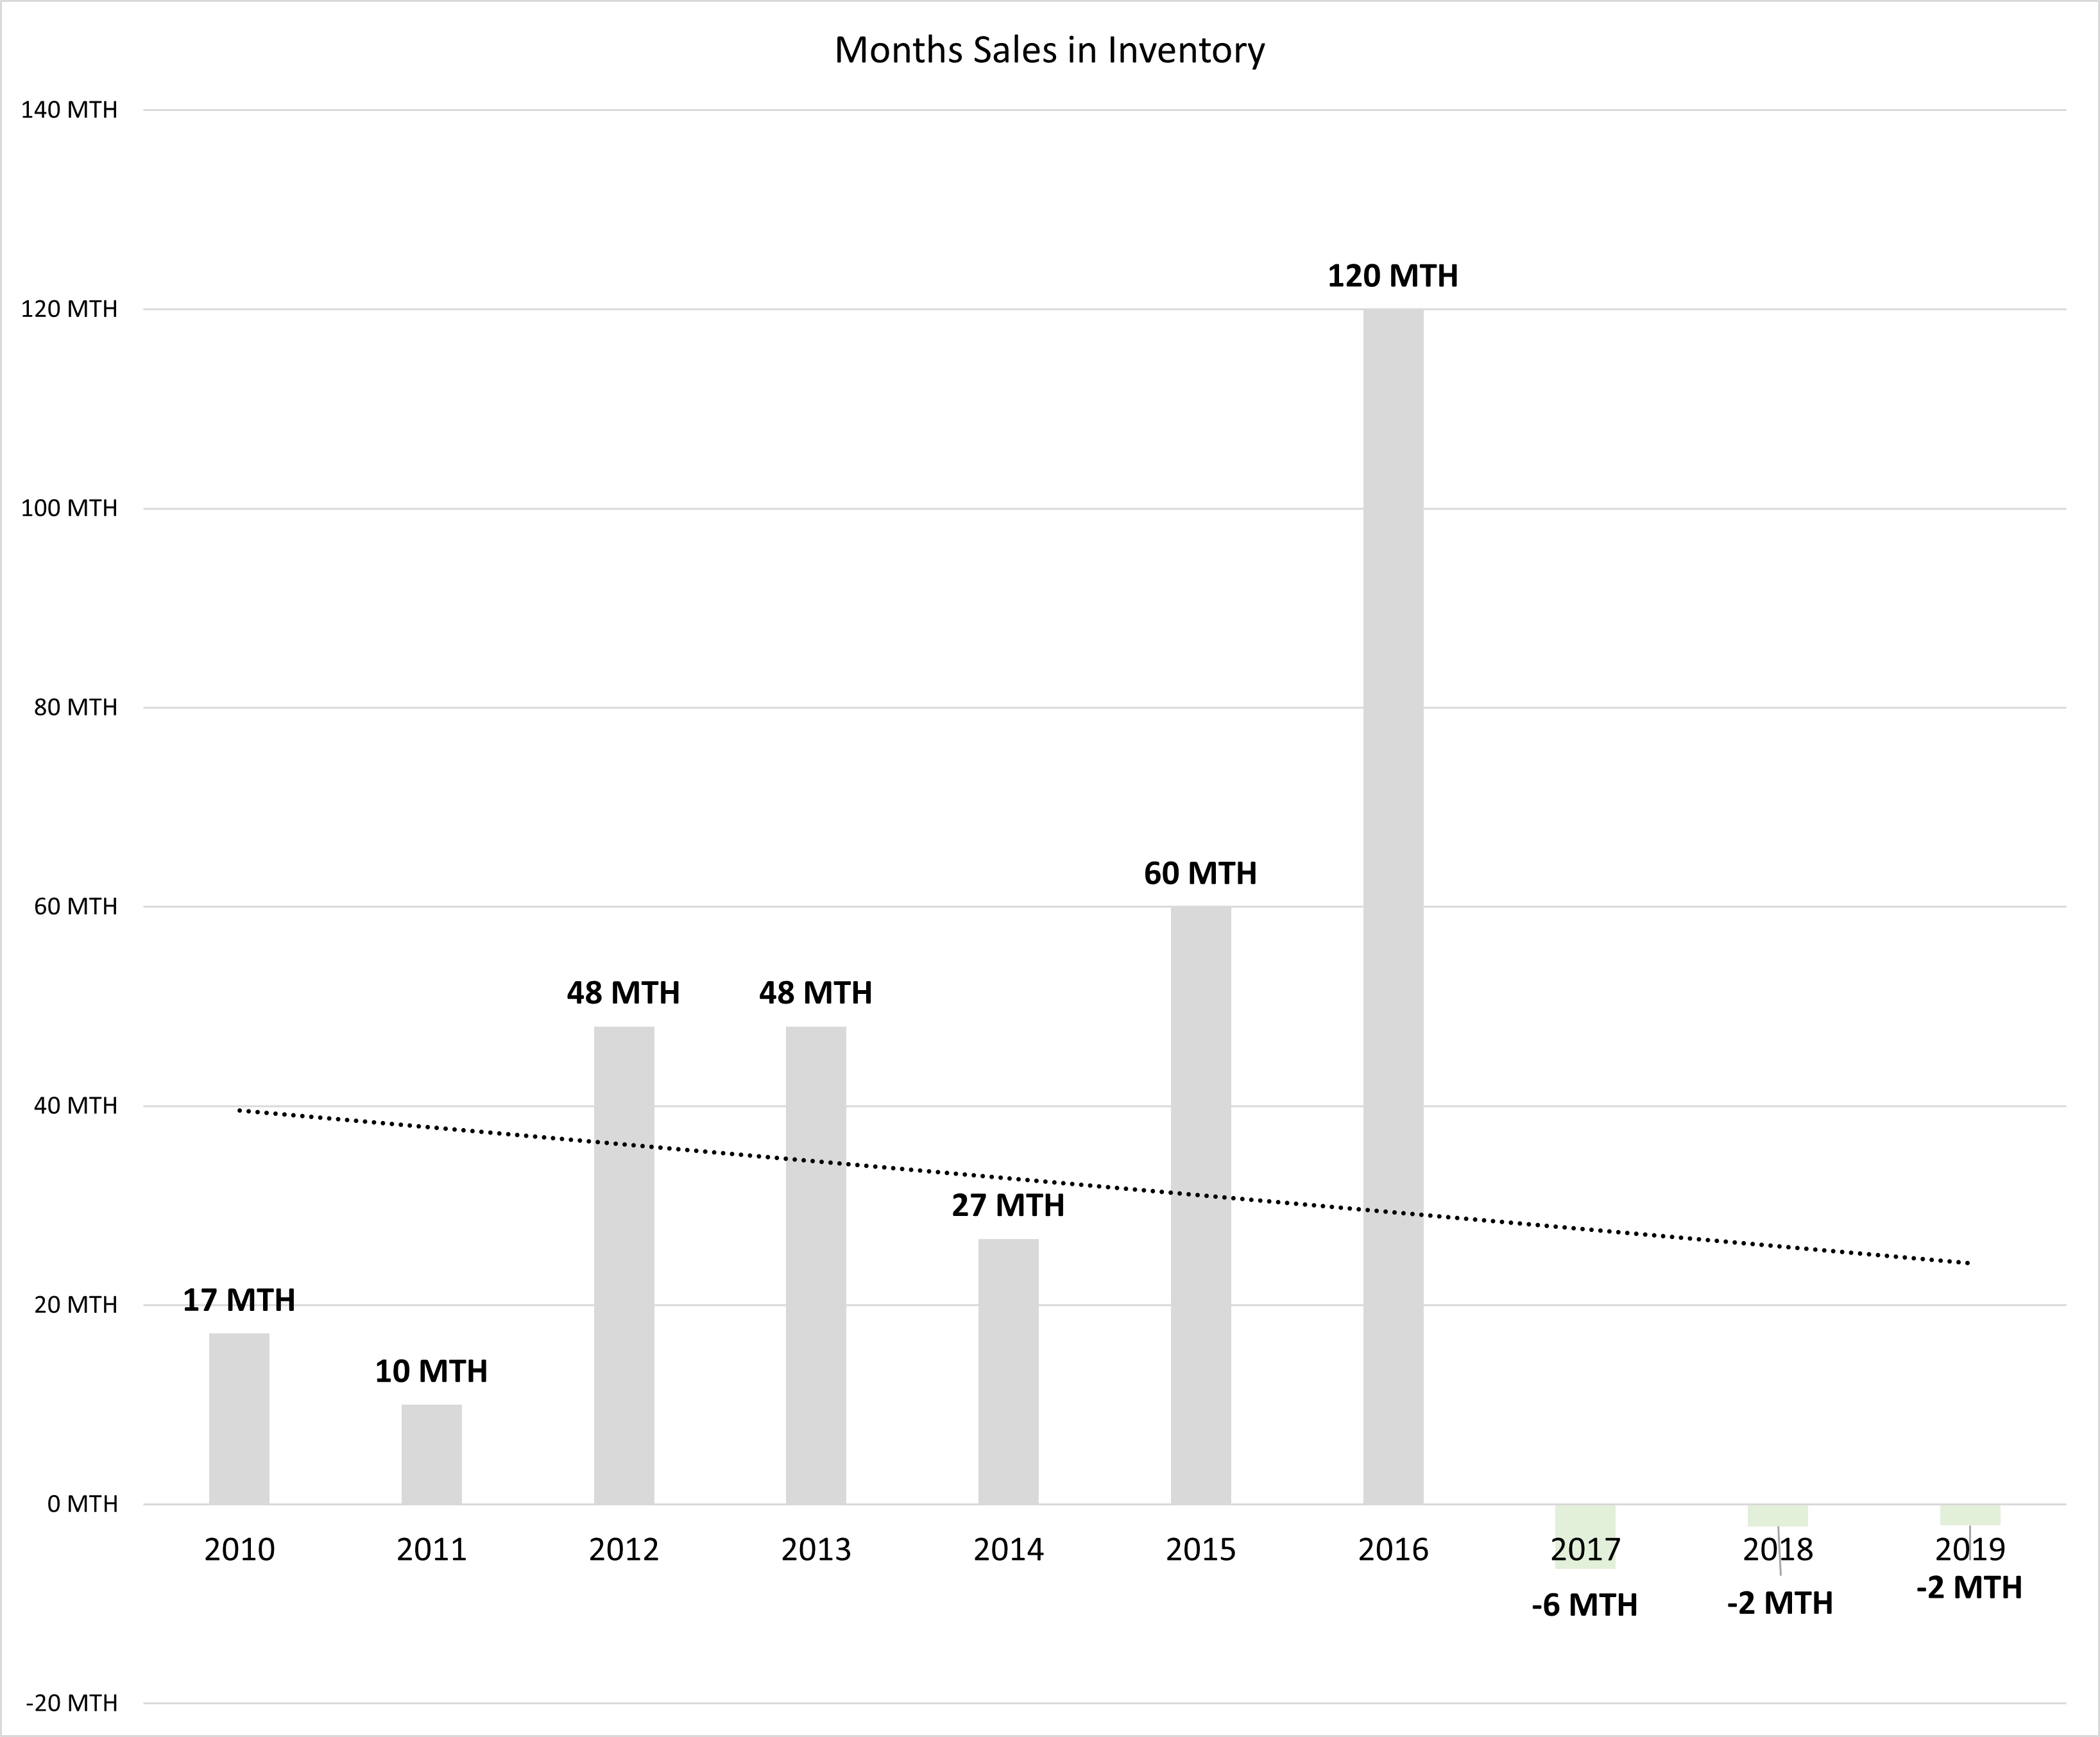
The monthly sales inventory ratio shows how many months it takes to sell GAW inventories. Usually inventories should be sold in 2-3months, if it sits out for too long, it collects dust, takes up space and the company loses money on opportunity costs and warehouse expansion.
Since 2017, there have been a significant transformation, resulting to the improvement in performance. The linear trendline shows the steady reduction of monthly sales in inventory.
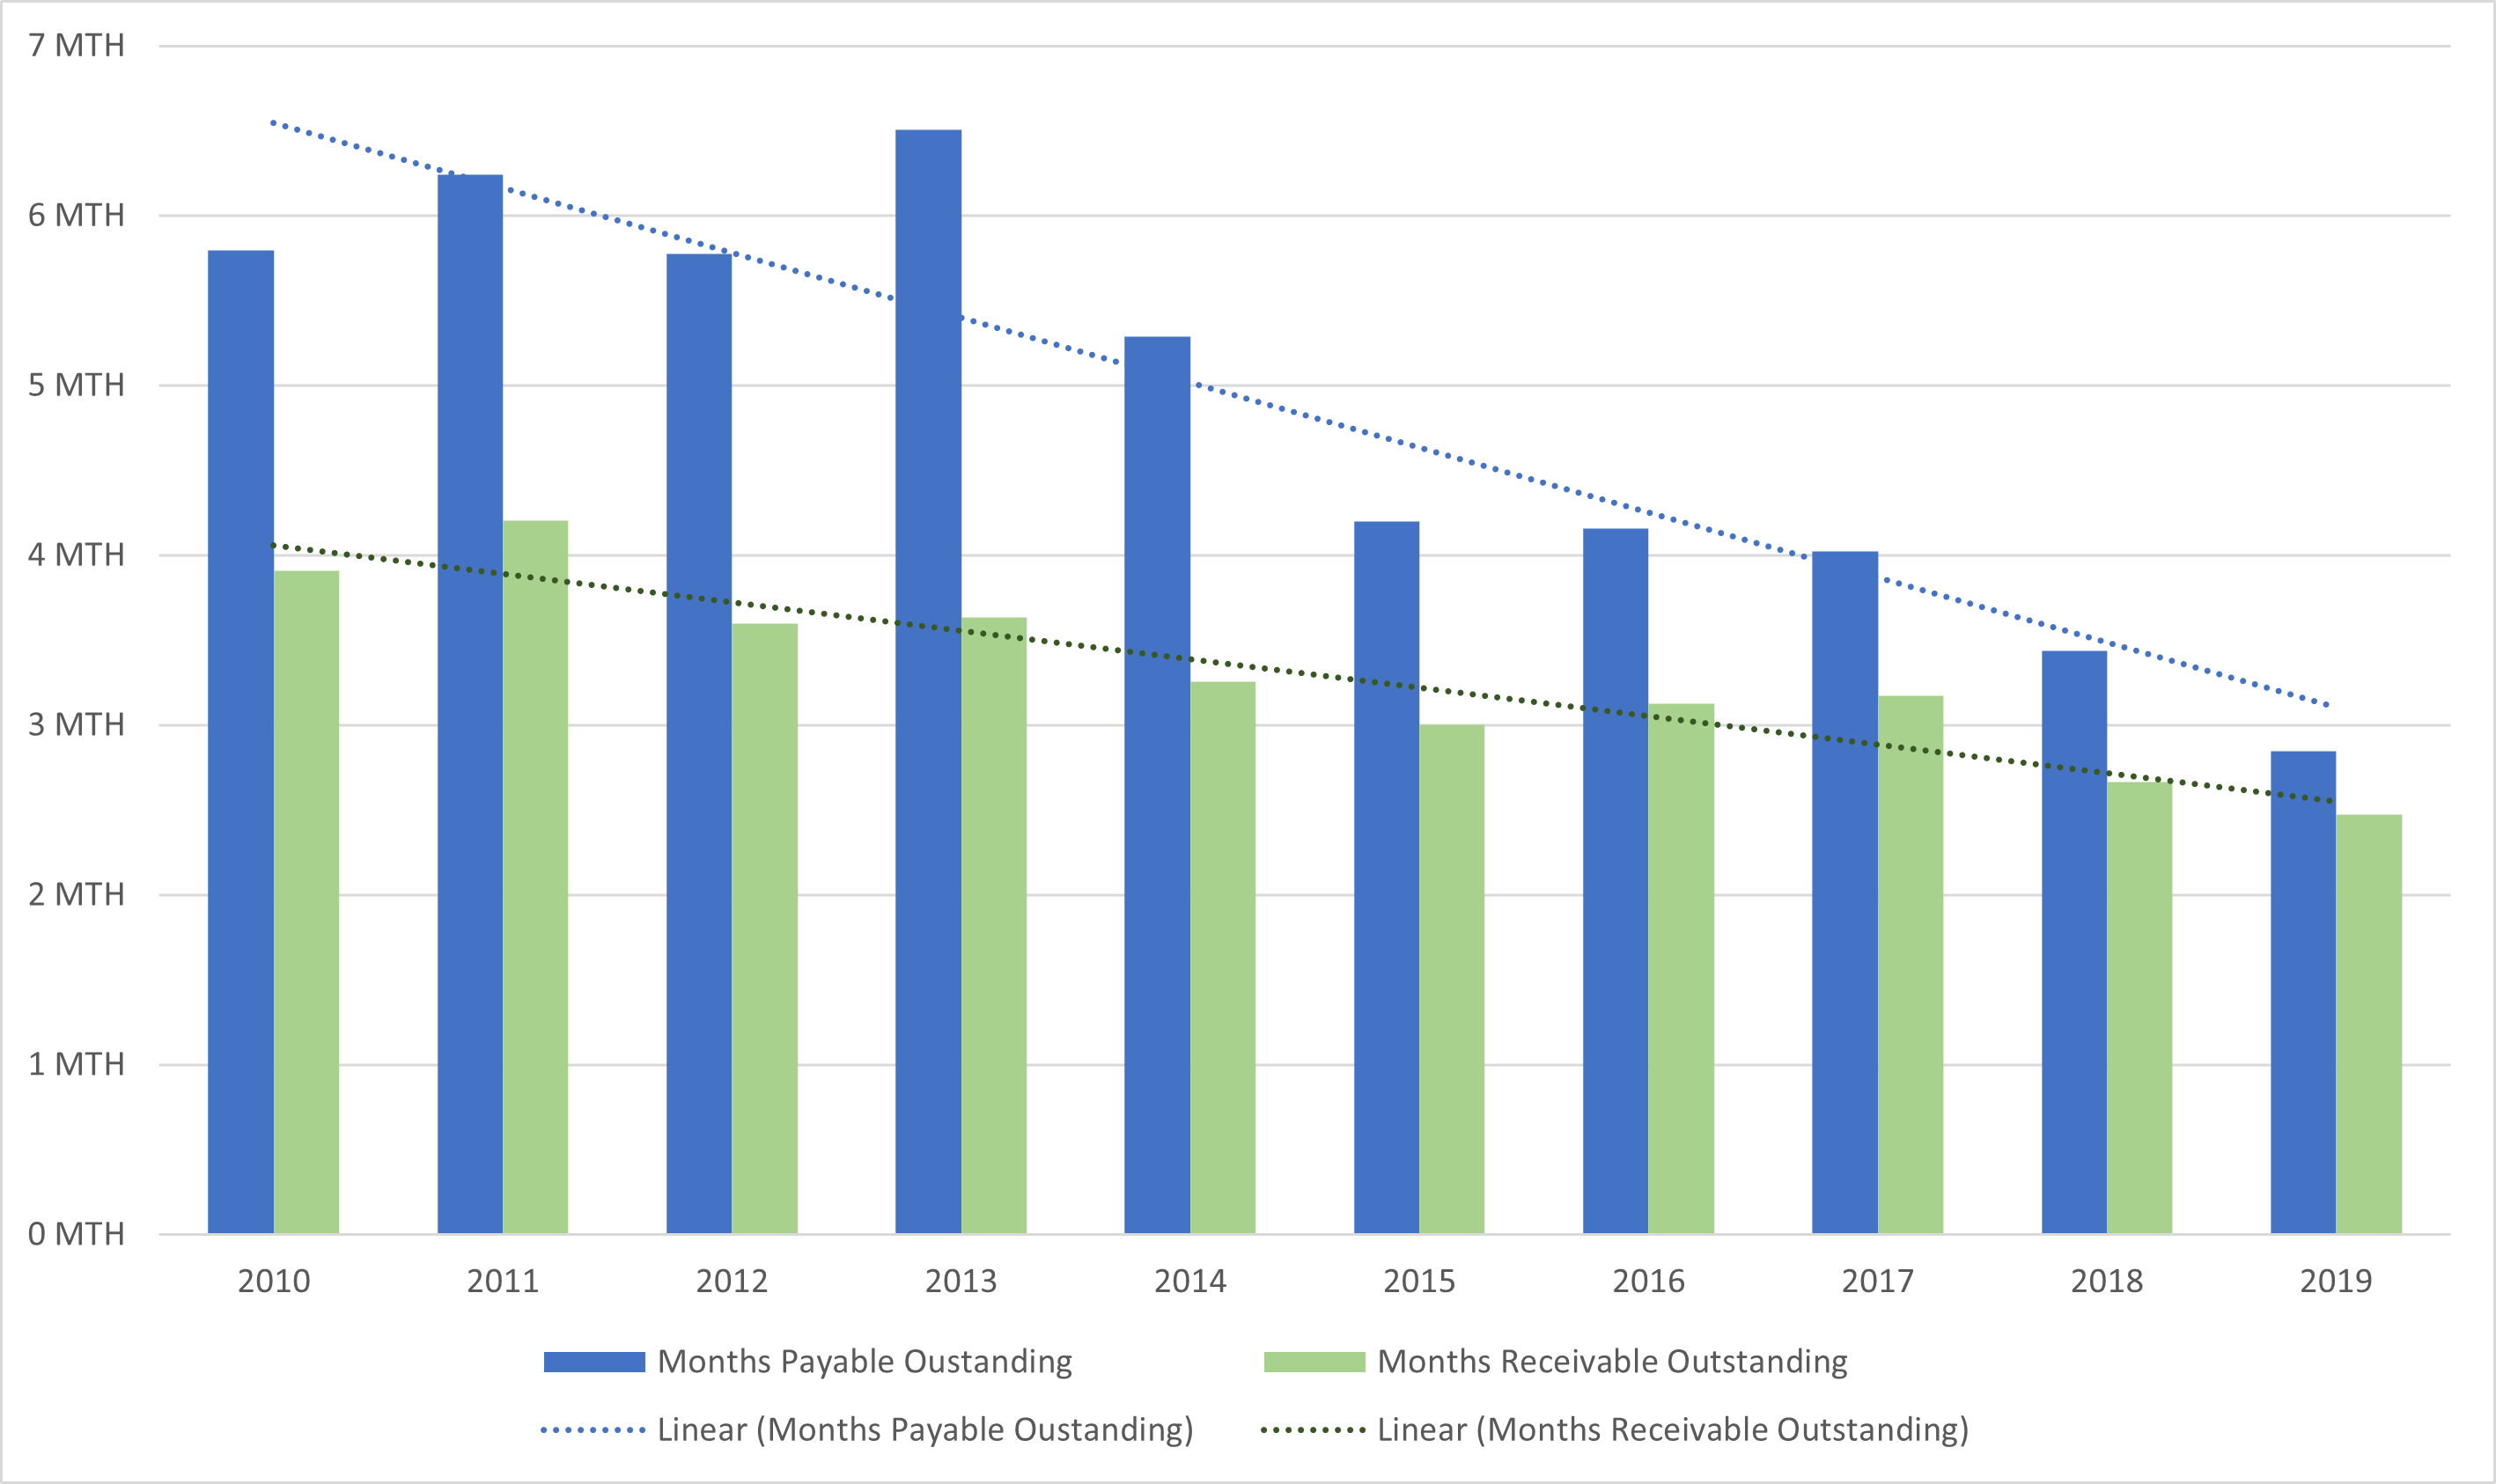
Months payable outstanding shows that the company takes less than a year to pay off their creditors.
Months receivable outstanding also takes less than a year to collect payment for sale of goods.
Both ratios have gradually been reducing year on year, which is a good sign that the company is improving the way their manage their working capital.
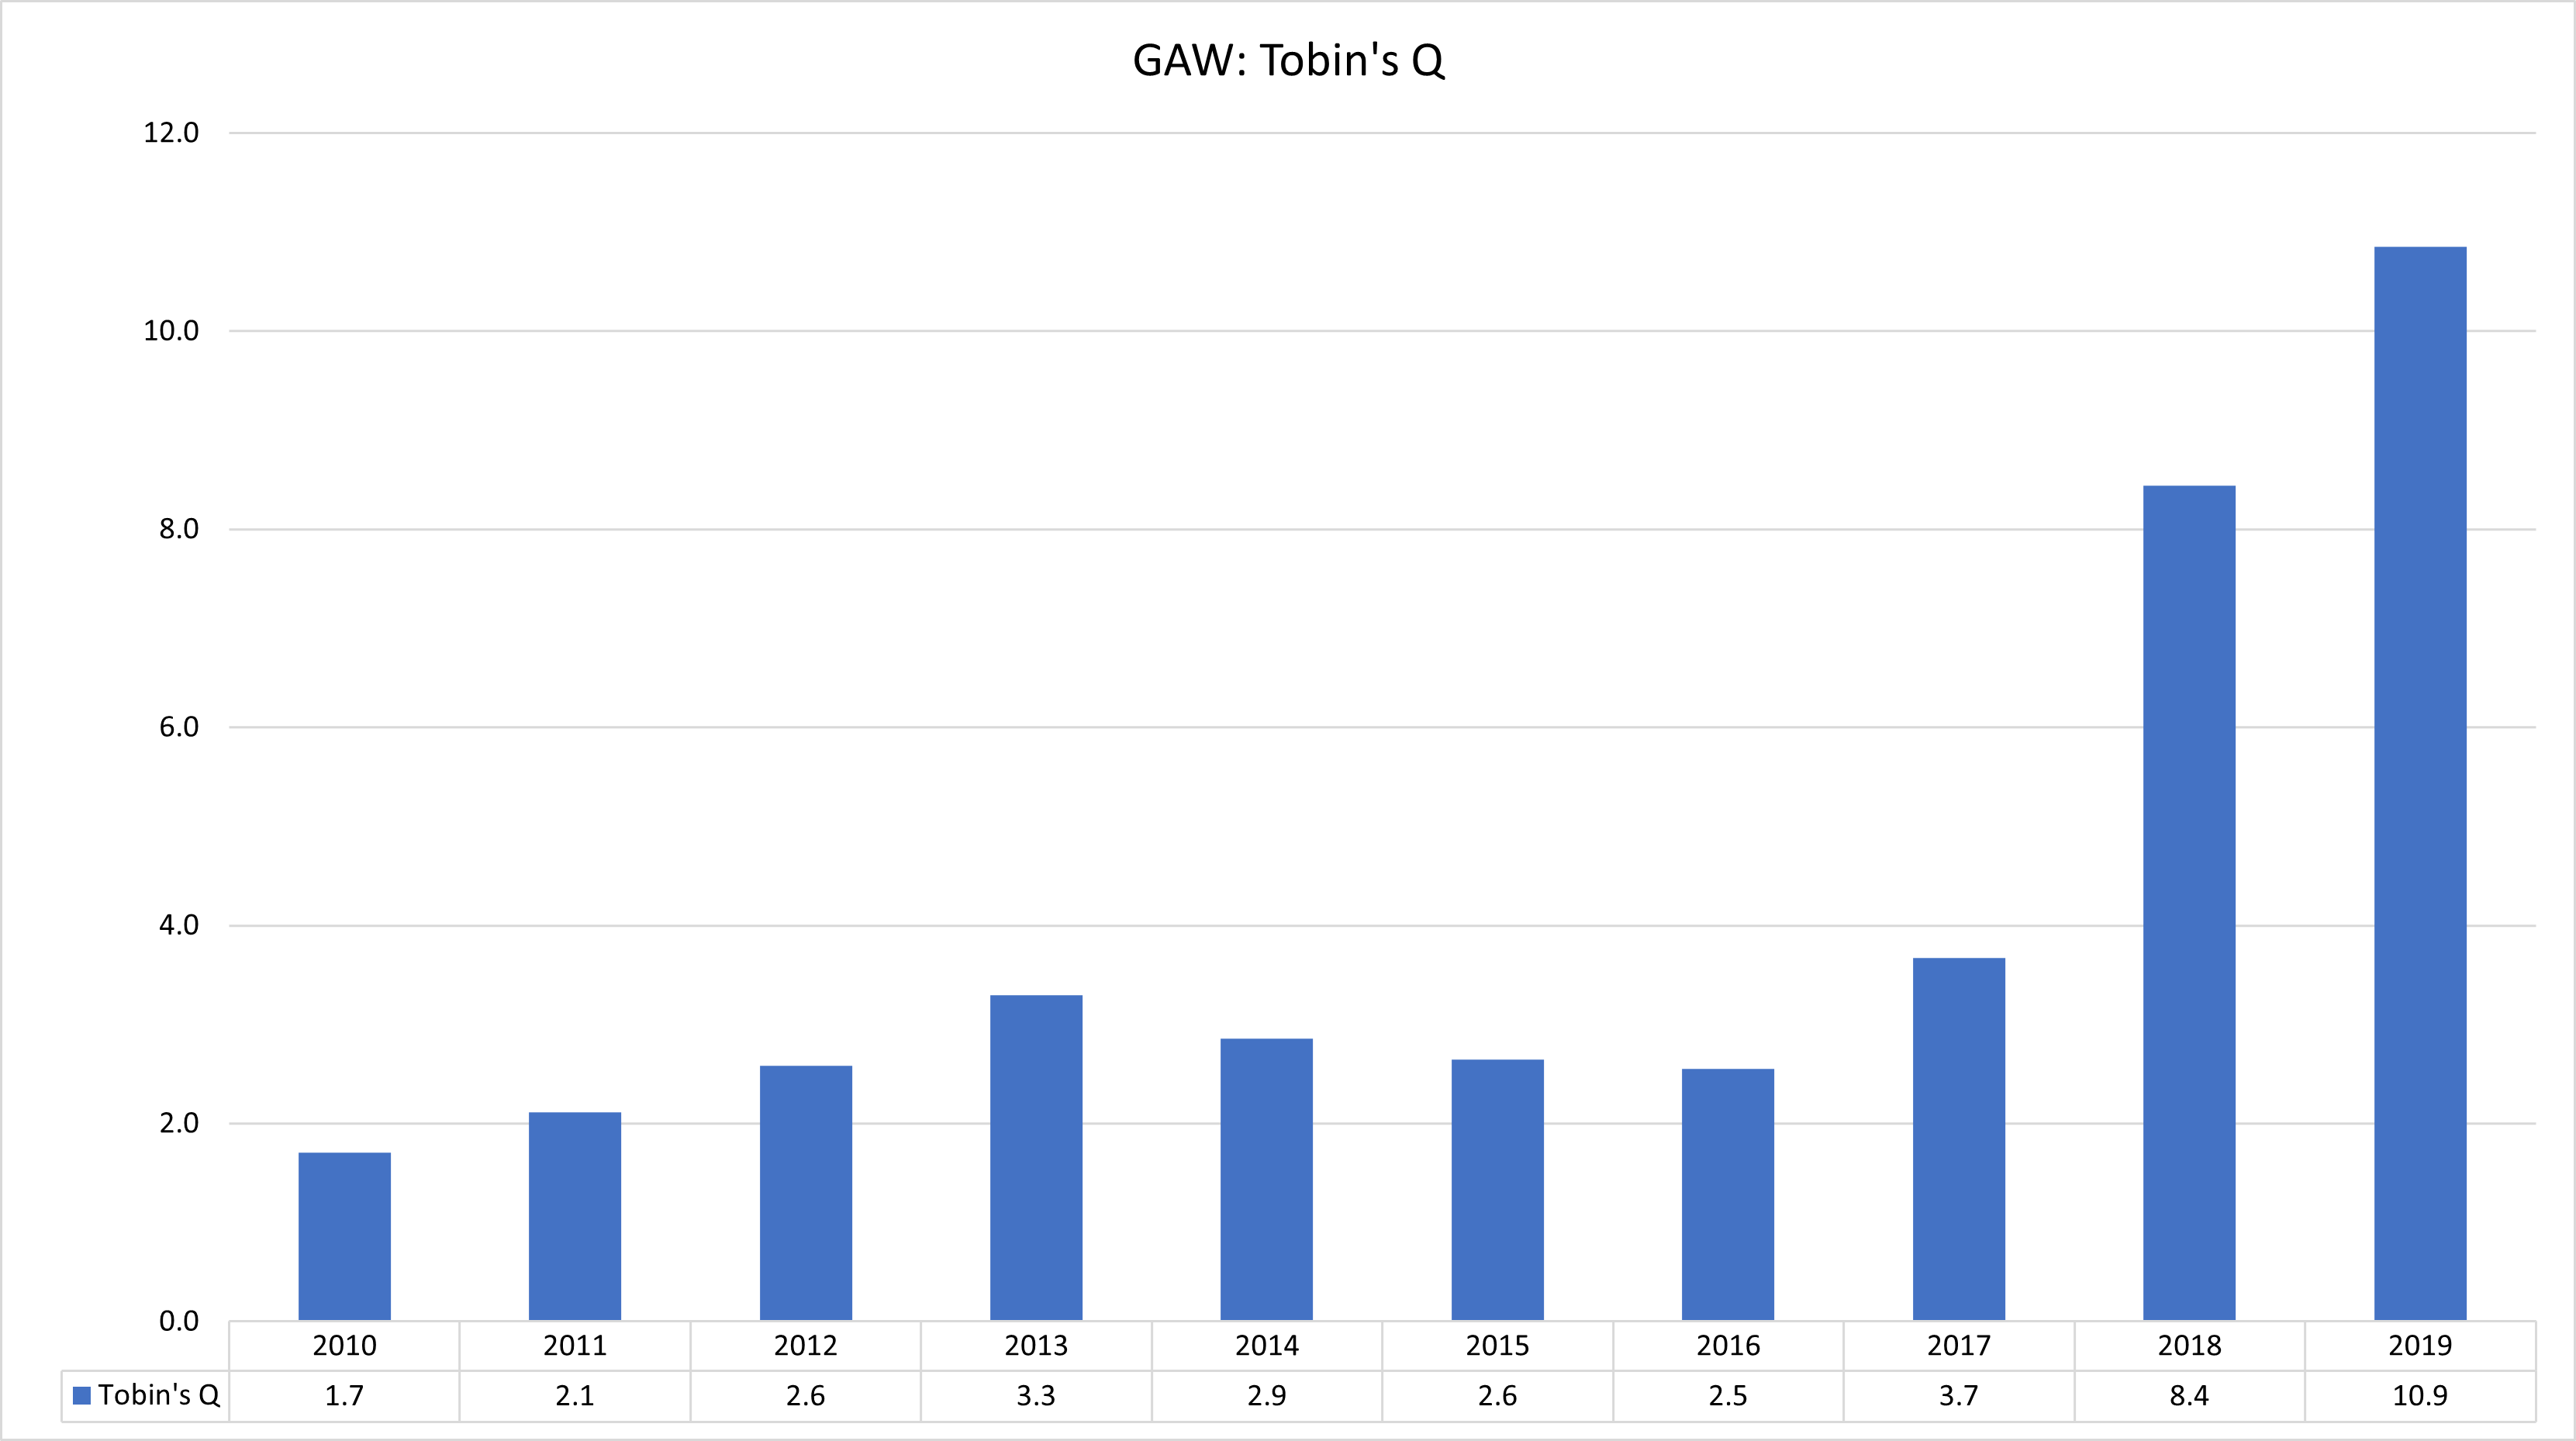
Tobin’s q is a useful ratio to identify the surplus of intangible assets of a firm. The ratio is used to compare the market value of equities to the cost of replacing a company’s assets.
If Tobin’s q is over 1, then the market places some value on intangible assets. Thus, the higher the ratio, the more the market value is explained by intangibles.
Since 2017, Tobin’s q ratio has been much higher for the firm, which shows that intangible assets make up a huge proportion of their replacement assets.
Tobin’s q = (MVE+PS+WC+L.DEBT)/TA
Where:
MVE= Market Value Of Equities
PS = Book Value Of Preferred Shares
WC = Working Capital
L.DEBT = Long-term Debt
TA = Total Asset
I chose 2016 to 2019 to measure the periods that intangible assets add value to a firm’s revenue growth and profit margin.
The economic benefits for intangibles usually take effect between six to forty-eight months:
Cost savings from improved operational processes (6-12months)
Enhancing customer relationships (12-24months)
Product innovation (24-48months)
Social & regulatory adoption processes (48months >)
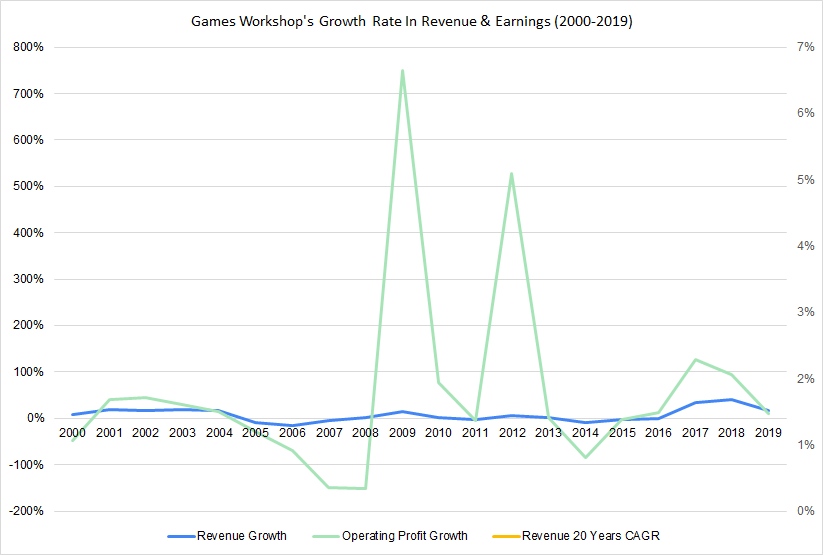
The compound rate in after-tax earnings less interest, Since 2016 to 2019, was 49%. Between 2010 to 2016, growth rate in after-tax earnings were 0% and so I didn’t need to apply the difference in growth rates. I subtracted the 6% organic growth rate (including inflation adjustment) from the results to get the rate for their intangible value contribution (43%).
CAGR 2016 to 2019 = (65.69m/13.45m)^(1/4)-1 =49%Intangible Value Contribution rate = 49%-6% = 43%
Value Creation Factor
I used the value creation factor to determine whether a company creates or destroys value. A creation factor above the cost of capital, i.e., >1, shows that a company invests in profitable ventures, while a creation factor below 1 shows that a company destroys value when they invest in projects.
To calculate the value creation factor, I divided the intangible value contribution rate by the cost of capital.
Value Creation Factor = (43%/9%) = 4.8xGAW achieved a value creation factor of 4.8 for their intangible value contribution. The value added from intangibles is high. The results are not typical of companies who distribute three quarters of their earnings to shareholders.
A 75% distribution in earnings for a business with good capital allocation for active reinvestment is usually 1.5 to 2.0x.
The ratio also shows that the firm creates 4.8 times of value whenever they plough money into back into it.
I multiplied the creation factor (4.8x) by the reinvestment earnings to get the annual sustainable reinvestment (64.5 million).
Annual Sustainable Reinvestment = 4.8*13.43m = 64.5mThe next step is to figure out how much of the annual sustainable reinvestment return is attributed to their hidden assets.
I divided the annual sustainable reinvestment by their the purchase cost, i.e. enterprise value to get the active reinvestment rate.
= (64.5m/1.167b)*100 = 5.5%The bigger picture
So far we know:
Cash Yield = 3.9%
Organic Growth = 2.5%
Active Reinvestment = 5.5%
Cost Of Capital = 9%
The sum of cash yield, organic growth and active reinvestment is 12% (11.9%).
Total Return = (3.9%+2.5%+5.5%) = 12%For my margin of safety, I divided the total return by the cost of capital, minus 1. The result was 32% more than the current market price.
Margin Of Safety = (12%/9%)-1 = 32% The chart shows the results of the franchise growth valuation:
In my opinion your adjusted earnings calculation have one point that have to be improved. If you account for intangibles in capex (SG&A,R&D, intangibles acquired…) you have to put that all in your asset base to correctly calculate the capital intensity. I have tried to adjust the greenwald method to intangibles (makes sense nowdays) but is a hard task, because of the dificulty to pile all the acumulated intangible assets and amortization to arrive at something similar to Net PPE. Greewald method to calculate the intrínsic value of a company is for me the right WAY to do, i need to work my model to achieve a degree of confidence and use it as my main method. Thanks for the article!
Thanks for posting the best practical application of Greenwald's book that I have seen!